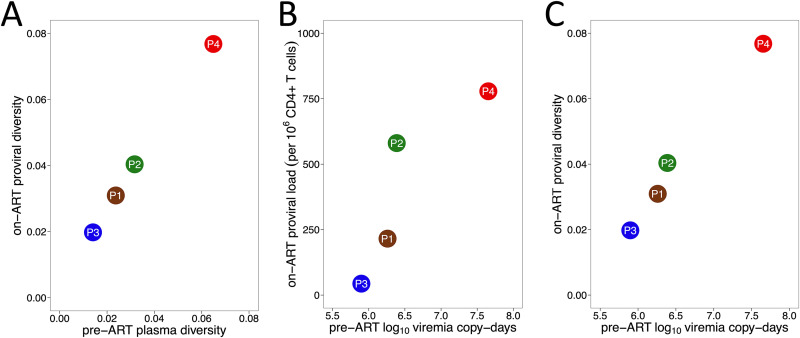
FIG 7.
Correlates of proviral burden and diversity. (A) Relationship between pre-ART plasma HIV RNA diversity and proviral diversity on ART. (B) Relationship between total area under the plasma viral load curve pre-ART, measured in log10 viremia copy days, and total proviral burden during ART. (C) Relationship between total area under the plasma viral load curve pre-ART and overall proviral diversity during ART, where the latter is measured as average patristic (tip-to-tip phylogenetic) distance between all distinct proviral sequences recovered from each participant.

