Fig. 4.
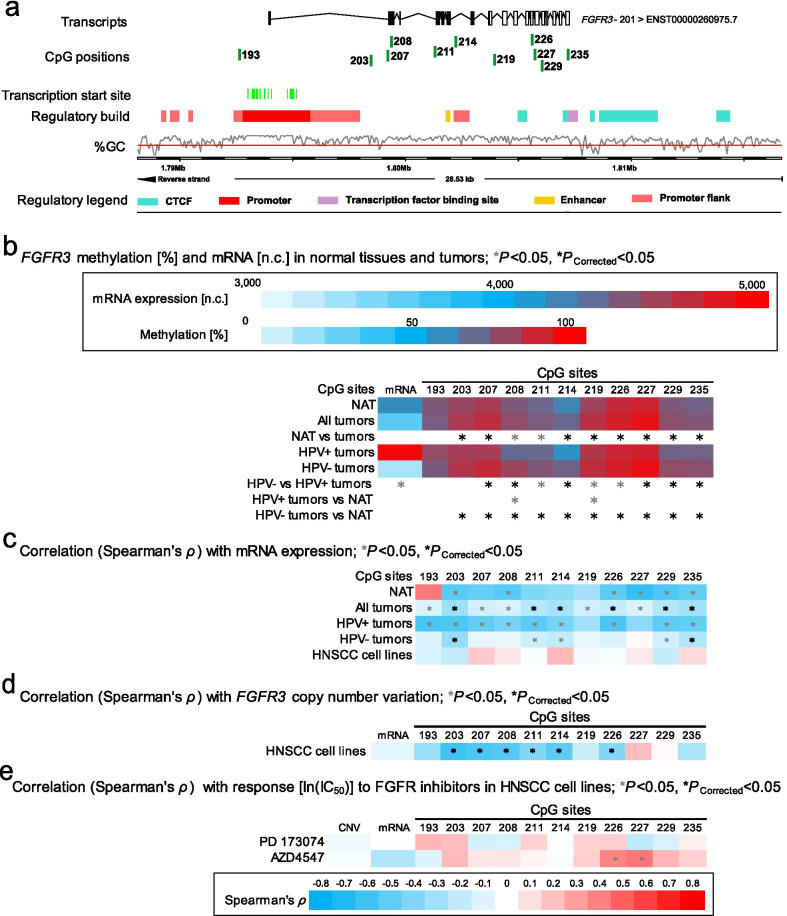
Correlation and association of FGFR3 DNA methylation with mRNA expression, HPV status, and sensitivity to FGFR-targeted TKIs. a Genomic context of eleven selected CpG sites within FGFR3 included into the present study. The illustration, including the predicted regulatory build [63] and transcription start sites according to the Eponine algorithm [64], was exported from www.ensemble.org [65]. b Methylation levels within the eleven selected CpG loci within FGFR3 and mRNA expression levels in NAT and tumor tissues and HPV(−) and HPV(+) tumors. c Spearman’s ρ of correlations between DNA methylation and FGFR3 mRNA expression. d Spearman’s ρ of correlations between FGFR3 DNA methylation and mRNA expression with FGFR3 amplification. e Spearman’s ρ of correlations of FGFR3 DNA methylation, CNV, and mRNA expression with ln(IC50) of PD 173074 and AZD4547. Statistically significant features are marked with asterisks *. P values (corrected and uncorrected) refer to Wilcoxon-Mann–Whitney U test for comparisons and to Spearman’s ρ for correlations analysis, respectively

