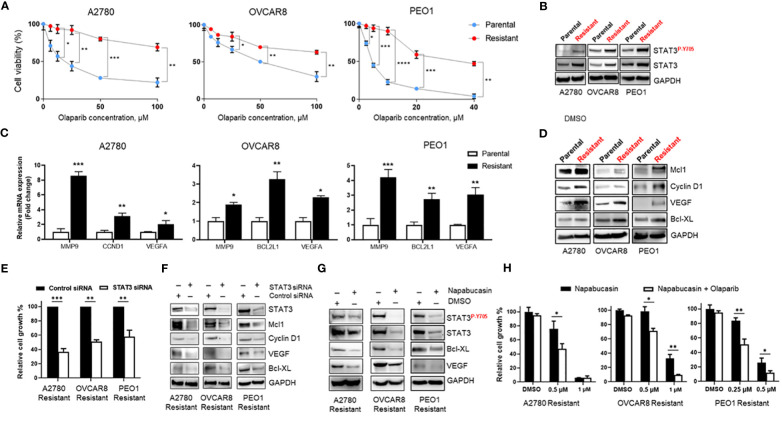
Figure 2.
STAT3 activation is elevated in Olaparib-resistant cell lines and genetic or pharmacological STAT3 targeting inhibits Olaparib-resistant tumor cell proliferation (A) Drug-response curves of survival after Olaparib treatment of parental and acquired Olaparib-resistant A2780, OVCAR8 and PEO1 cells at 72 h. Shown are representative graphs from three independent experiments as means ± SD (n = 4). Unpaired two-tailed Student t-test of Olaparib-resistant cells performed against parental controls at increasing drug concentrations. Shown are means ± SD. *p<0.05, **p<0.01, ***p<0.001, and ****p<0.0001. (B) Western blot showing activated (P-Y705) and total STAT3 levels in parental and Olaparib-resistant A2780, OVCAR8, and PEO1 cells. GAPDH staining served as a loading control. (C) Real-time PCR measuring STAT3 target gene MMP9, CCND1, BCL2L1 and VEGFA mRNA levels in parental and Olaparib-resistant A2780, OVCAR8 and PEO1 cells. Gene expression was normalized to the housekeeper gene ACTB and relative expressions are shown. Unpaired two-tailed Student t-test of Olaparib-resistant cells performed against parental controls. Shown are means ± SD (n = 3). *p<0.05, **p<0.001, and ***p<0.0001. (D) Western blot analyzing STAT3 target gene levels in parental and Olaparib-resistant A2780, OVCAR8, and PEO1 cells. GAPDH staining served as a loading control. (E) Cell proliferation analysis of Olaparib-resistant A2780, OVCAR8, and PEO1 cells transfected with either control or STAT3 siRNA. Unpaired two-tailed Student t-test was performed against siRNA controls. Shown are means ± SD (n = 4). (F) Western blotting measuring STAT3 target gene levels in Olaparib-resistant A2780, OVCAR8, and PEO1 cells incubated either with either scramble or STAT3 siRNA for 72 h. GAPDH staining served as a loading control. (G) Western blotting showing STAT3 target gene levels in Olaparib-resistant A2780, OVCAR8, and PEO1 cells treated either with 0.1% DMSO or Napabucasin (0.5 µM for A2780 Resistant and OVCAR8 Resistant, 0.25 µM for PEO1 Resistant cells) for 72 h. GAPDH staining served as a loading control. (H) Cell proliferation assay showing the indicated Napabucasin concentrations kill and sensitize Olaparib-resistant ovarian cancer cells to either 40 µM (for A2780 Resistant and OVCAR8 Resistant) or 10 µM (for PEO1 Resistant) Olaparib. Unpaired two-tailed Student t-test of combinatorial Napabucasin and Olaparib treatment performed against single Napabucasin treatment. Shown are means ± SD (n=3). *p<0.05, **p<0.001.

