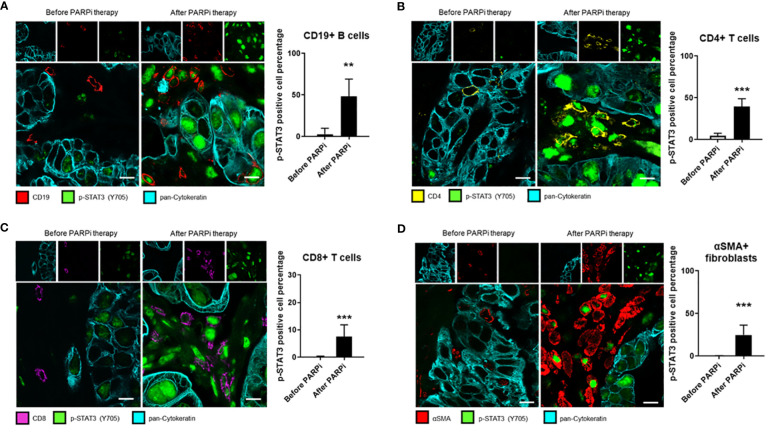
Figure 3.
STAT3 activity in ovarian cancer patient tumor-associated immune cells and fibroblasts is elevated post PARPi treatment. Representative immunofluorescence images of tumor sections from six gBRCA ovarian cancer patients before and after PARPi treatment showing p-STAT3 (green), pan-Cytokeratin (cyan), and either CD19+ B cells (red) in (A), CD4+ T cells (yellow) in (B), CD8+ T cells (magenta) in (C) or αSMA+ cancer-associated fibroblasts (red) in (D). Cytokeratin-stained cell clusters represent malignant tissue. Scale bars = 10 μm. Histograms (right) showing p-STAT3 expressing cell percentage within indicated populations. Unpaired two-tailed Student t-test performed against the before treatment group. Results represent means ± SD, n = 9 (nine images acquired before and nine images acquired after PARPi treatment from the same patient, six patients total). **p<0.01, ***p<0.001.

