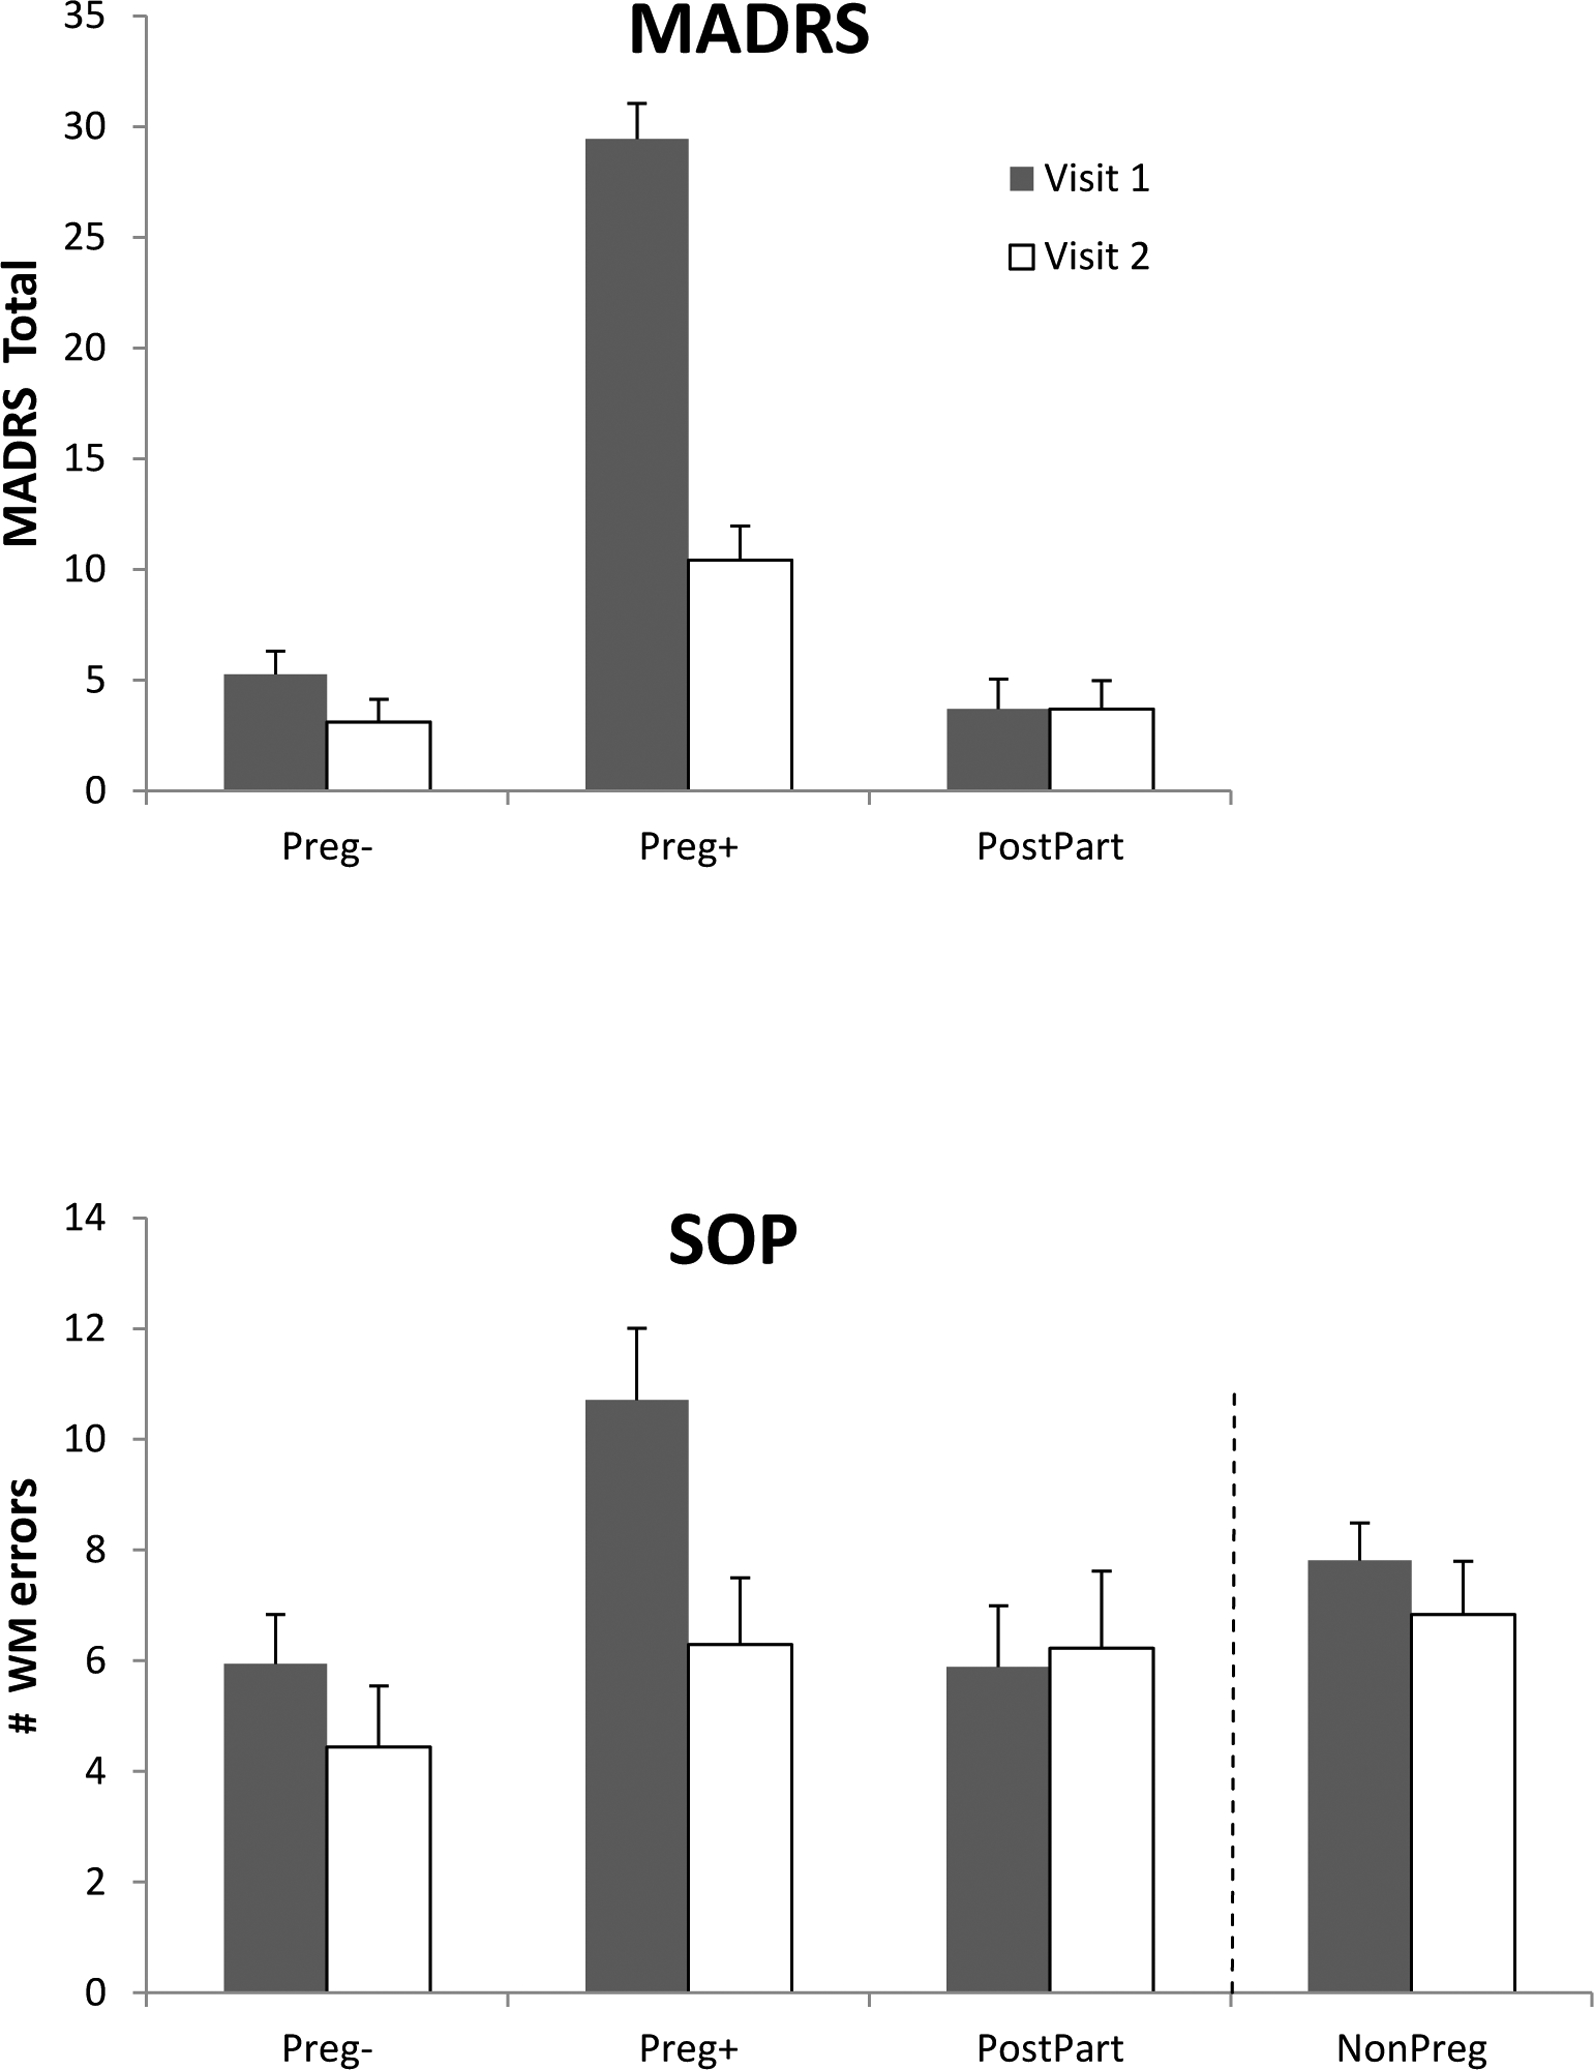
Figure 3.

Changes from Visit 1 to Visit 2 in MADRS depression scores (top panel) and in the numbers of WM errors produced on the SOP task (bottom panel). The Preg− and Preg+ women were pregnant on Visit 1 but on Visit 2 they were tested in the postpartum, approximately 14.0 to 14.5 weeks post-delivery. On Visit 2, the Preg+ women, who had been clinically depressed at Visit 1, showed a significant reduction in depressive affect (top panel) and a significant reduction in WM errors on the SOP, p < .01 (bottom panel). Other groups showed no significant change between Visits. The NonPreg controls are shown for reference in the bottom panel based on all available data at each timepoint (Visit 1, Visit 2), and irrespective of phase of cycle when tested. Bars represent the standard error of the mean.
