. 2021 Jan 8;11(4):2175–2184. doi: 10.1039/d0ra07135h

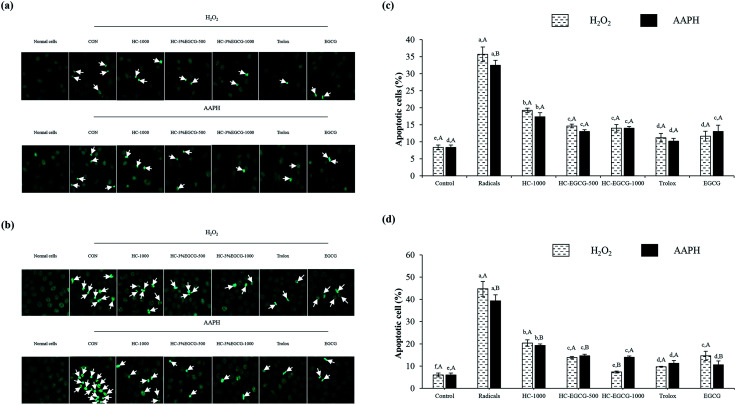
Fig. 7. Nuclear morphology of MRC-5 cells (a) HaCaT cells (b) and amount of apoptotic cells after treatment with oxidative stressors (c and d). Bars represent the standard deviation (n = 3). Different lowercase letters on bars within the same stressor tested indicate significant differences (p < 0.05). Different uppercase letters on bars within the same compounds tested indicate significant differences (p < 0.05). CON: cells treated with 0.1 mM H2O2 or 0.1 mM AAPH alone, HC-1000: cells treated with HC at 1000 μg mL−1, HC–3% EGCG-500 and HC–3% EGCG-1000: cells treated with HC–3% EGCG conjugate at 500 and 1000 μg mL−1, respectively. Trolox: cells treated with trolox at 50 μM. EGCG: cells treated with EGCG at 50 μM.

Fig. 7