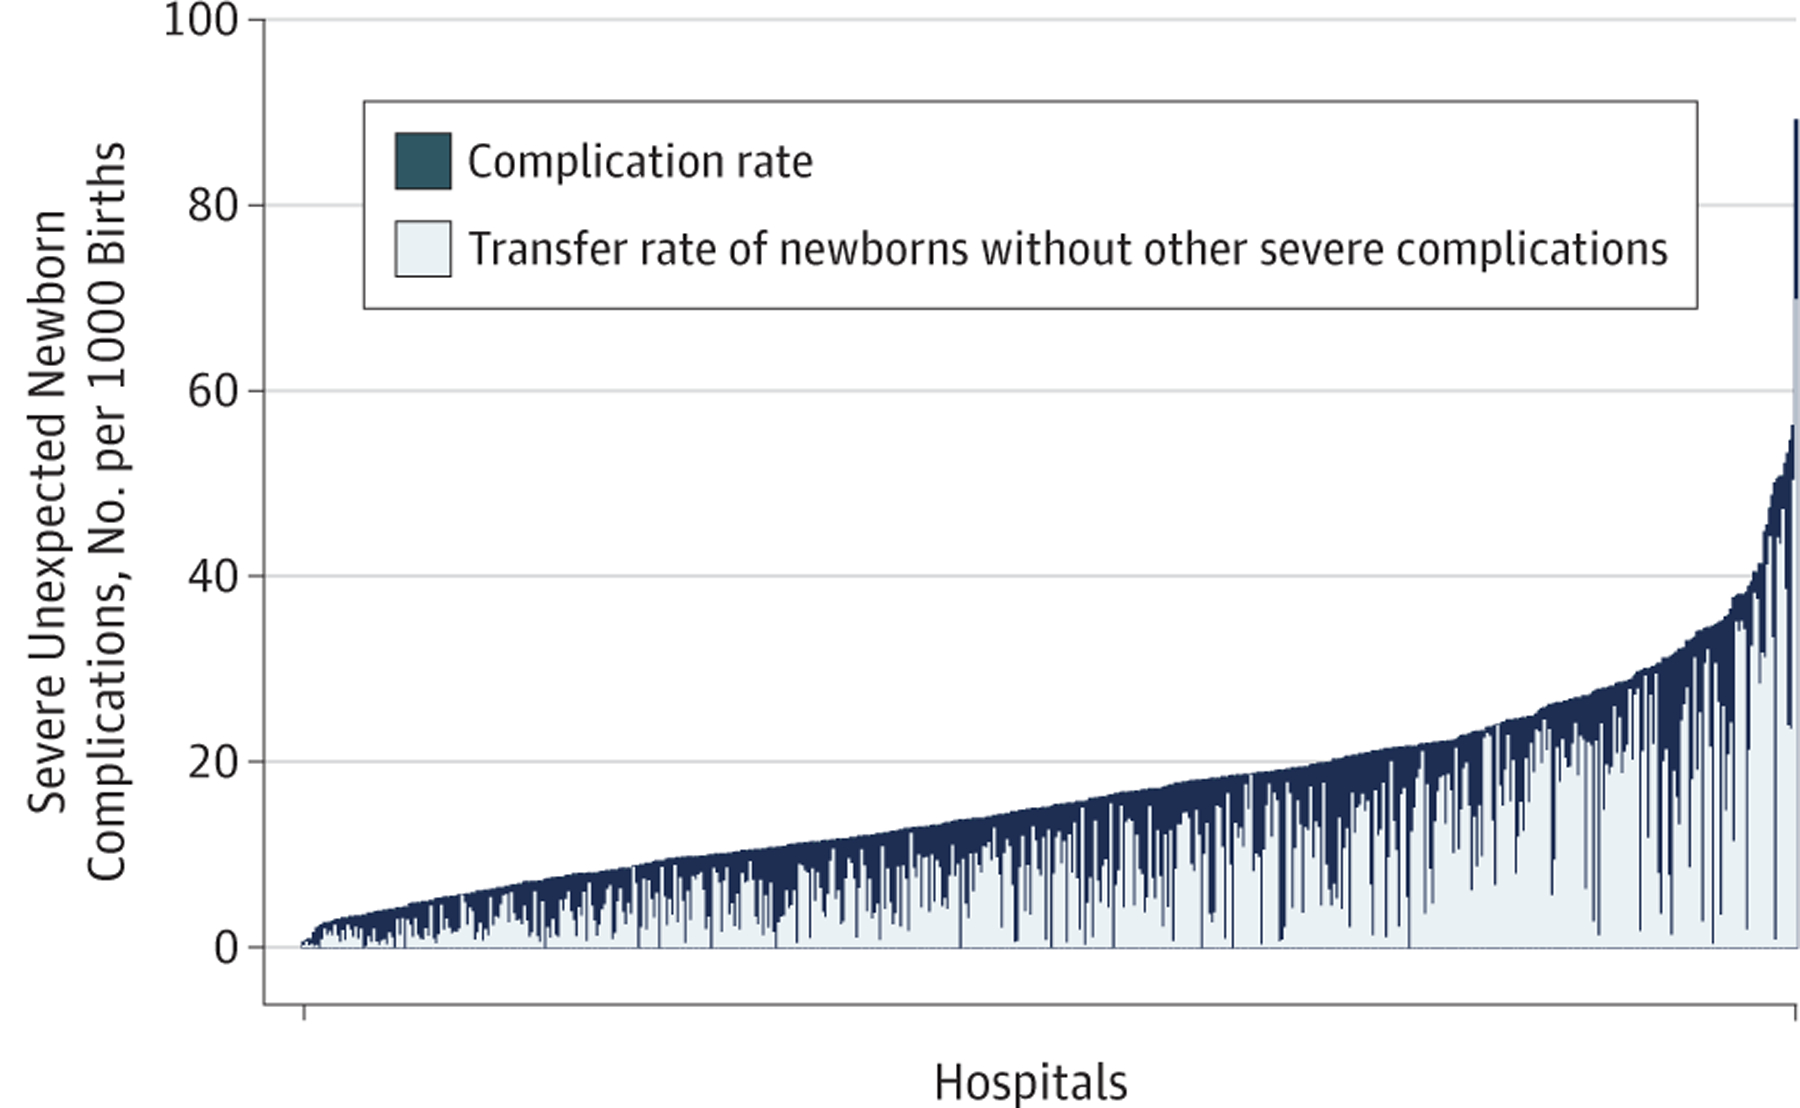
Figure 1.

Severe Unexpected Newborn Complication and Neonatal Transfer Rates by Hospital
The dark blue bars represent a hospital’s severe unexpected complication rate, which considers neonatal transfer to be a severe complication. The overlying light blue bars show the relative contribution of neonatal transfer (ie, the number of newborns transferred without another severe complication) to the overall complication rate.
