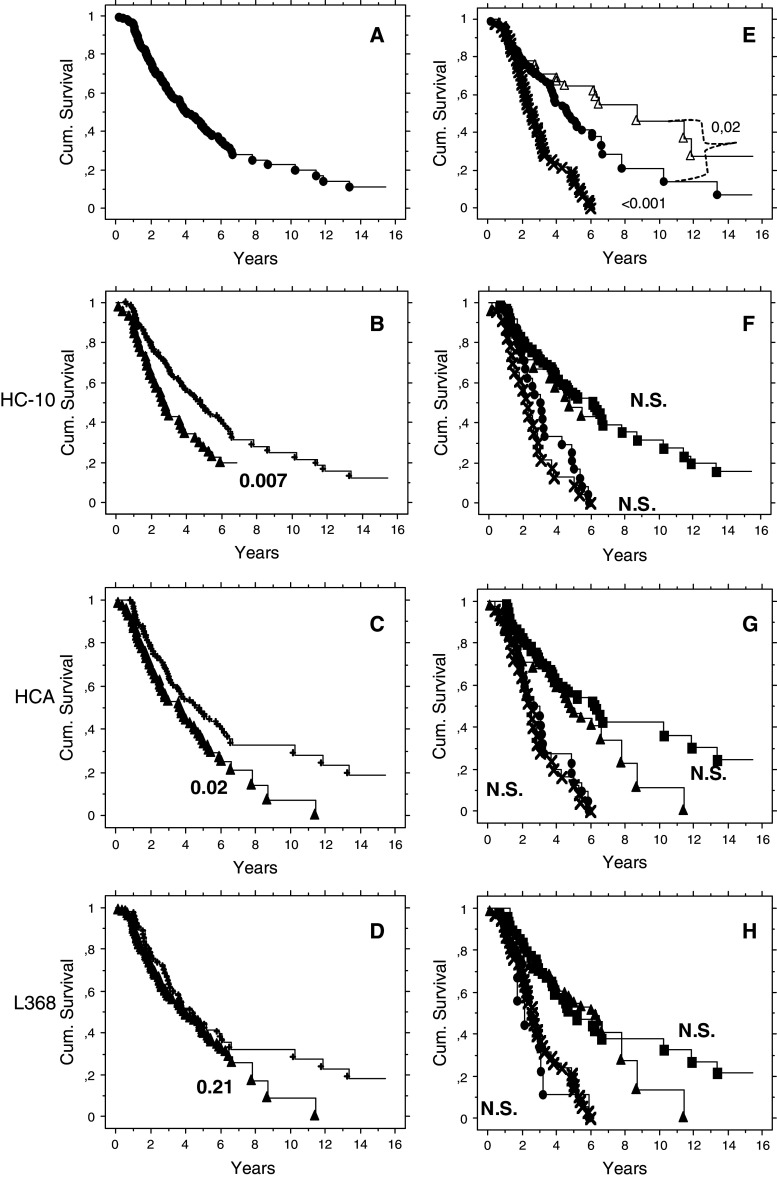
Fig. 2.
Kaplan–Meier and log-rank P values. a All the cohort. b Immunohistochemistry staining with HC10 mAb. High (plus symbol) and low (filled triangle). c Stained HCA mAB. d Stained with L368 mAb. e Kaplan–Meier and log-rank P values of patients stratified for stage III–IV and serous histology and HLA-A02*. WP (times symbol) versus BP (filled circle) and BP HLA-A02* (open triangle). f As in E but in the log-rank calculation are considered also the subsets defined by HC10, HCA (g) and L368 (h). BP: high (filled square); low (filled triangle). WP: high (filled circle); low (times symbol)

