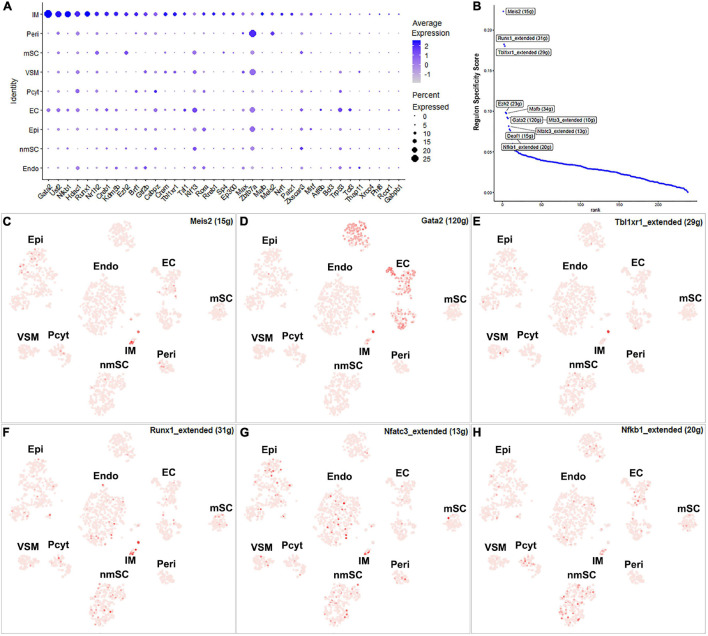
FIGURE 11.
TF activity in immune cells. (A) Thirty-seven identified TFs expressed in more than 5% of immune cells. (B) Regulon-specificity score in immune cells with top 10 specific TFs labeled. (C–H) The tSNE showing regulon activity for Meis2, Gata2, Tbl1xr1, Runx1, Nfatc3, and Nfkb1 in immune cells.

