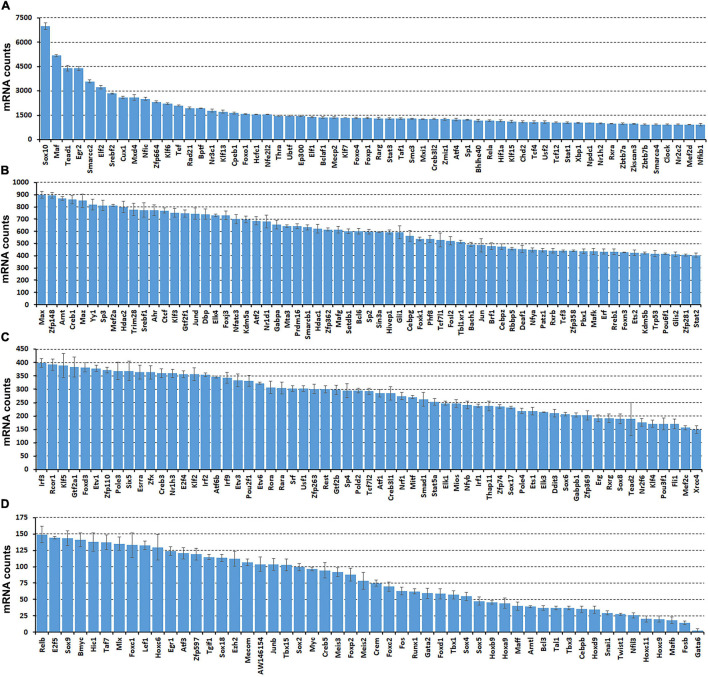
FIGURE 2.
Comparison of normalized messenger RNA (mRNA) counts for the identified 238 TFs in intact mouse sciatic nerve to show their relative expression in mRNA levels. Bulk mRNA sequencing data was analyzed with the data set, GSE108231. (A) Sixty TFs have mRNA count bigger than 900. (B) Sixty-five TFs have mRNA counts ranging from 400 to 900. (C) Sixty-one TFs have mRNA count ranging from 150 to 400. (D) Fifty-two TFs have mRNA count smaller bigger than 150. Normalized mRNA counts are shown as mean ± SEM, n = 3.

