. 2021 Jan 12;11(5):2596–2607. doi: 10.1039/d0ra10322e

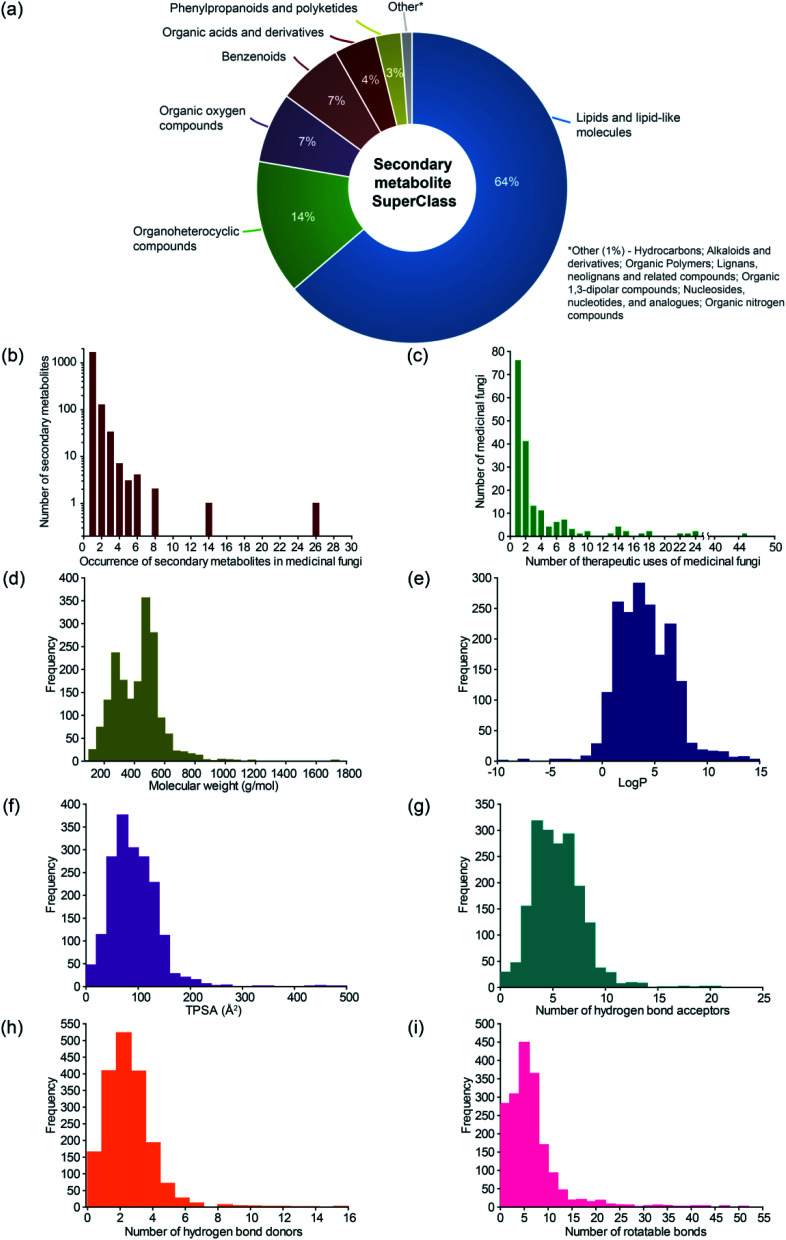
Fig. 3. Basic statistics for medicinal fungi, their secondary metabolites and therapeutic uses in MeFSAT database. (a) Pie chart shows the distribution of the secondary metabolites in MeFSAT across chemical SuperClasses obtained from ClassyFire.21 (b) Histogram of the number of medicinal fungi with literature evidence of producing a given secondary metabolite in MeFSAT database. (c) Histogram of the number of therapeutic uses per medicinal fungi in MeFSAT database. (d–i) Histogram of the distribution of molecular weight (g mol−1), log P, topological polar surface area (TPSA) (Å2), number of hydrogen bond acceptors, number of hydrogen bond donors, and number of rotatable bonds, for the secondary metabolites in MeFSAT database.

Fig. 3