. 2021 Jan 12;11(5):2596–2607. doi: 10.1039/d0ra10322e

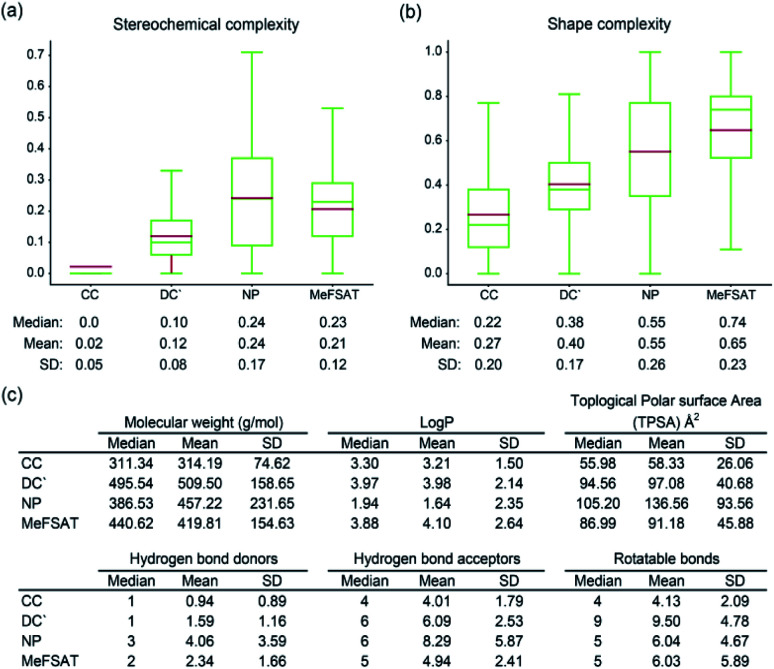
Fig. 4. Comparison of the physicochemical properties of secondary metabolites in MeFSAT with other small molecule collections. (a) Box plot shows the distribution of the stereochemical complexity of the small molecule collections CC, DC′, NP and MeFSAT secondary metabolites. The median, mean and standard deviation (SD) of the stereochemical complexity for each small molecule collection is shown below the box plot. (b) Box plot shows the distribution of the shape complexity of the small molecule collections CC, DC′, NP and MeFSAT secondary metabolites. The median, mean and SD of the shape complexity for each small molecule collection is shown below the box plot. Note the lower end of the box shows the first quartile, upper end of the box shows the third quartile, green line shows the median and brown line shows the mean of the distribution of stereochemical complexity or shape complexity in the two box plots. (c) Median, mean and SD of six physicochemical properties, namely, molecular weight, log P, topological polar surface area (TPSA), number of hydrogen bond donors, number of hydrogen bond acceptors, and number of rotatable bonds for the small molecule collections CC, DC′, NP, and MeFSAT secondary metabolites. Here, CC, DC′ and NP refer to small molecule collections of commercial compounds, diversity-oriented synthesis compounds and natural products, respectively (Methods).

Fig. 4