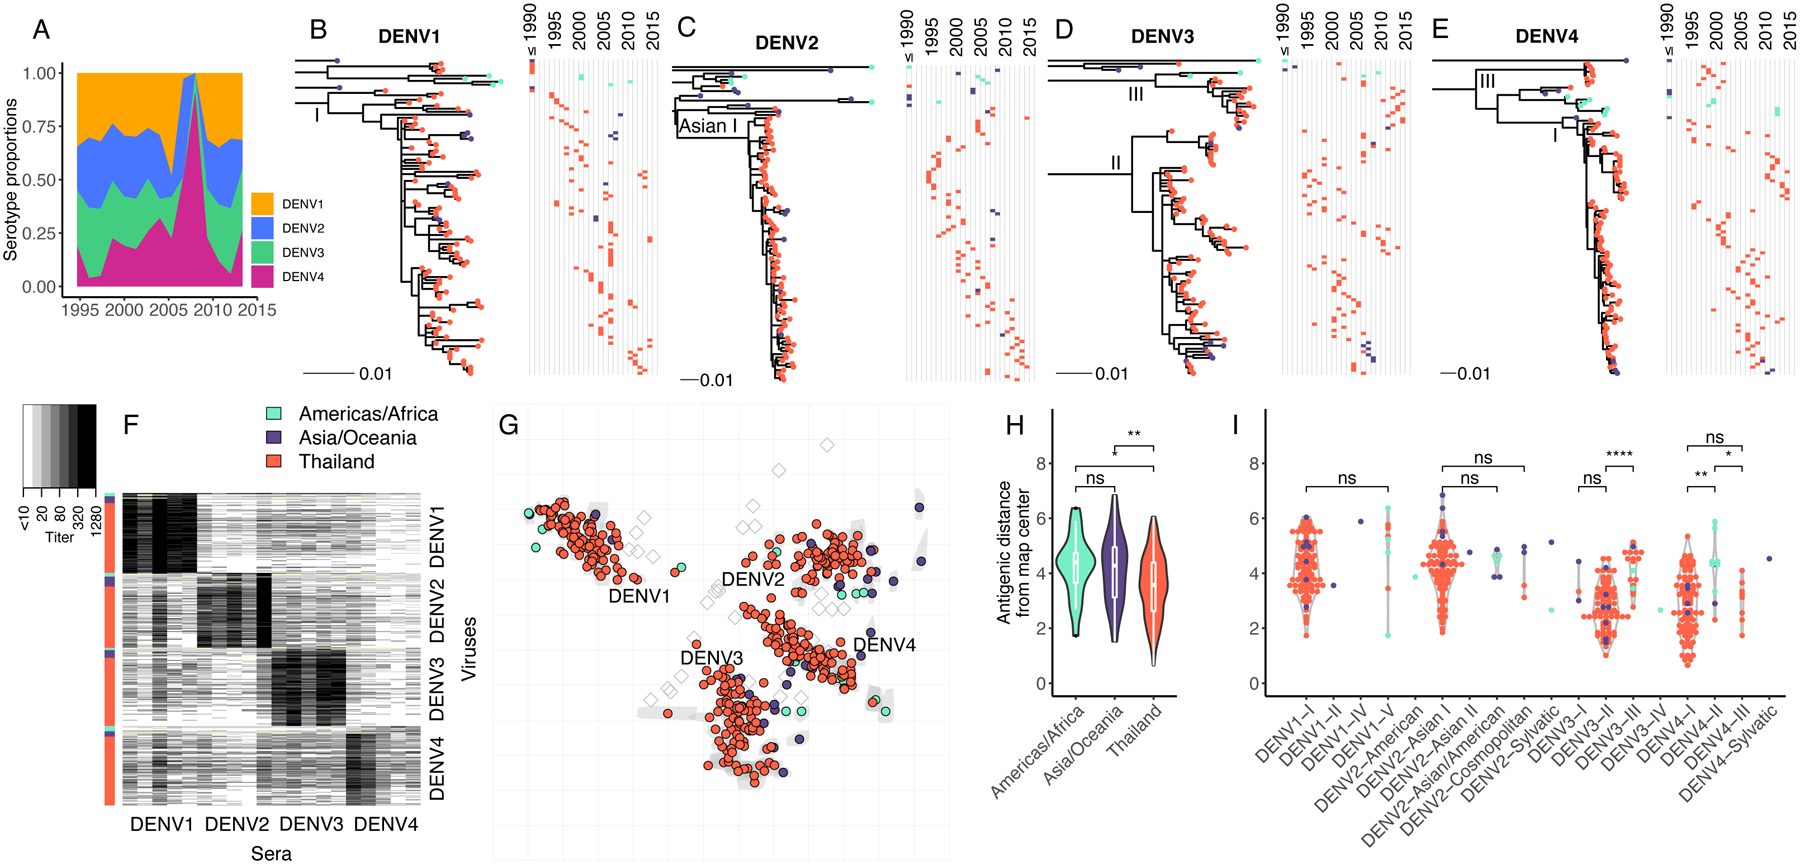
Fig. 1. Genetic and antigenic characteristics of DENV1–4 strains isolated in Bangkok, Thailand in relation to global DENV strains.

(A) Proportion by serotype of 1,944 clinical DENV strains isolated between 1994 to 2014 at QSNICH. Strains for antigenic characterization were selected from this full set. (B-E) Evolutionary relatedness among E protein sequences of DENV1–4 (n=348) from Thailand (1994–2014) compared to strains from other countries or periods in time (n=64). Maximum likelihood phylogenetic trees were built using generalized time reversible nucleotide substitution models with gamma-distributed rate variation and allowing for invariant sites (GTR+G4+I). Strains are colored to indicate the geographic area where the strain was isolated (Americas/Africa, Asia/Oceania, Thailand). Corresponding time series show the years of strain isolation. (F) Heat map of PRNT50 titers (n=7,957) for all DENV1 (n=105), DENV2 (n=99), DENV3 (n=103) and DENV4 (n=105) strains titrated against antisera from non-human primates (n=20, 5 per serotype) each inoculated with a genetically distinct global DENV strain. Rows correspond to DENV strains (row colors indicate region), while columns correspond to antisera. (G) Antigenic map made in two dimensions of all DENV1–4 strains. Grey shapes indicate interquartile range of coordinates for each virus based on cross-validation maps. Colored circles correspond to median coordinates for each virus. Each grid-square side corresponds to a two-fold dilution in the PRNT50 assay, and distance is interpretable in any direction. Sera are represented as open squares. Violin plots of antigenic distances of each virus from the center of the 3D antigenic map by location of virus isolation (H) or genotype (I). Global significance tests were conducted with a Kruskal-Wallis Rank Sum Test, followed by pairwise comparisons using the Wilcoxon Rank Sum test.
