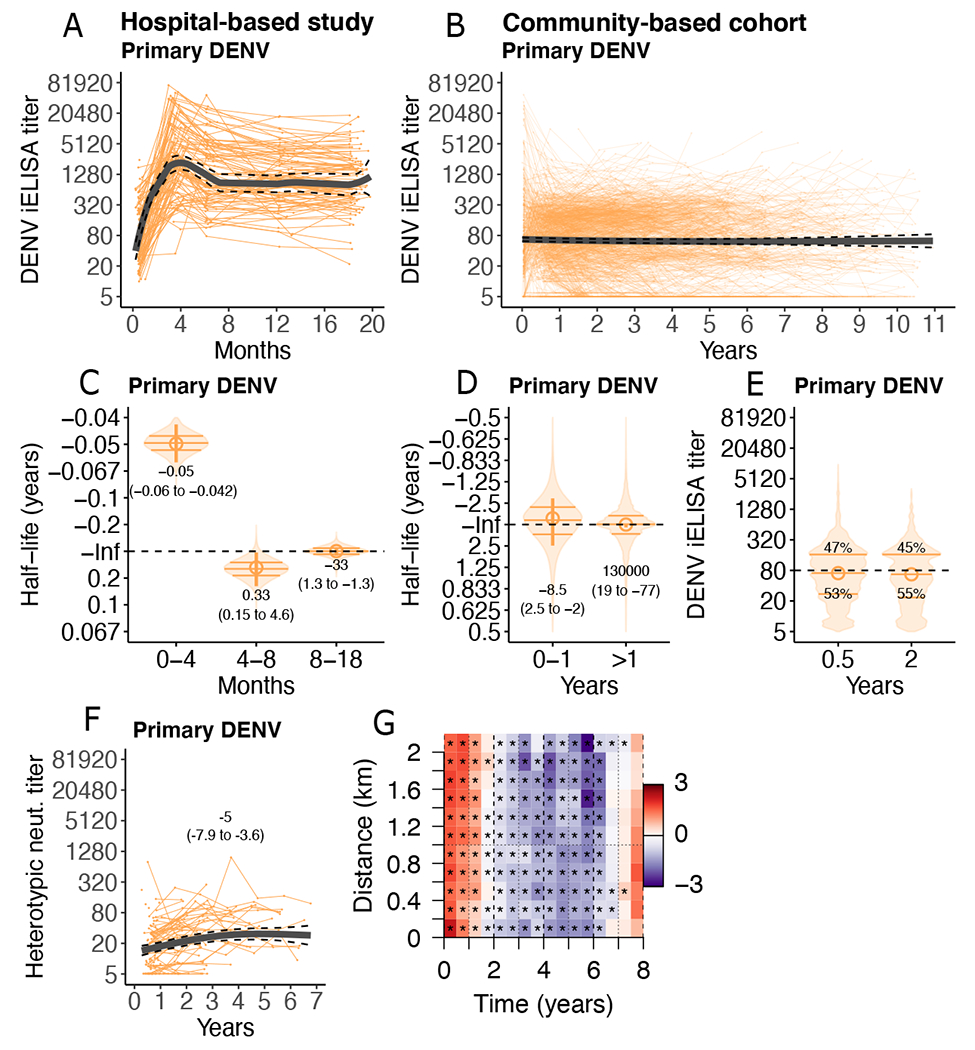
Fig. 2. Anti-DENV antibody titers after primary DENV infection reach stable setpoints.

(A and B) Individual trajectories of DENV iELISA titers (reciprocal serum dilution) in children following primary DENV infection in the hospital-based study (n=101; 505 titers, A) and community-based cohort (n=1201; 5117 titers, B). Group GAMM models (thick lines) with 95% confidence intervals (CIs, dashed lines) are shown. (C and D) Bootstrap sampling of multi-phasic linear mixed models of individual half-lives (violin plots, with quartiles marked as horizontal bars) and group half-lives (circles, 95% CI marked as vertical lines, with printed estimates) after primary DENV infection in the hospital-based study (C) and community-based cohort (D) are shown. Inf indicates infinity (horizontal dashed line). (E) Bootstrap distributions from multi-phasic linear mixed models of individual DENV iELISA titer setpoints (violin plots, horizontal bars indicate quartiles) for the community-based cohort are shown. Printed estimates indicate percent of children below versus above the indicated threshold (1:80; horizontal dashed line). (F) Heterotypic DENV neutralizing (neut.) titers for a subset of primary DENV infections in the community-based cohort (n=108) are shown, with GAMM fit and 95% CI, and printed half-life estimates from a linear mixed model. (G) Log-ratio of the pairwise difference in date of symptom onset and home location between symptomatic dengue cases of the same versus different serotypes in the community cohort is shown. Red indicates more homologous cases, purple more heterologous cases. Stars mark ratios statistically significantly different from 1 (p-values <0.001).
