
Figure 8.
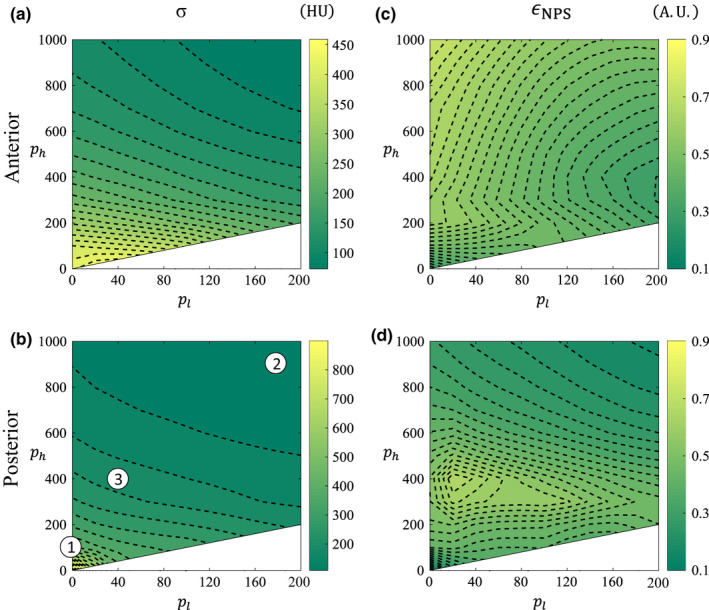
Noise contour maps in ATM‐space for the anterior and posterior spatial locations. (a, b) Noise standard deviation, σ, in HU. (c, d) NPS isotropy, ϵ NPS . Indexed parameters in (b) correspond to rows in Fig. 12. Note that ATM is not defined in the white space where p h < p l . [Color figure can be viewed at wileyonlinelibrary.com]