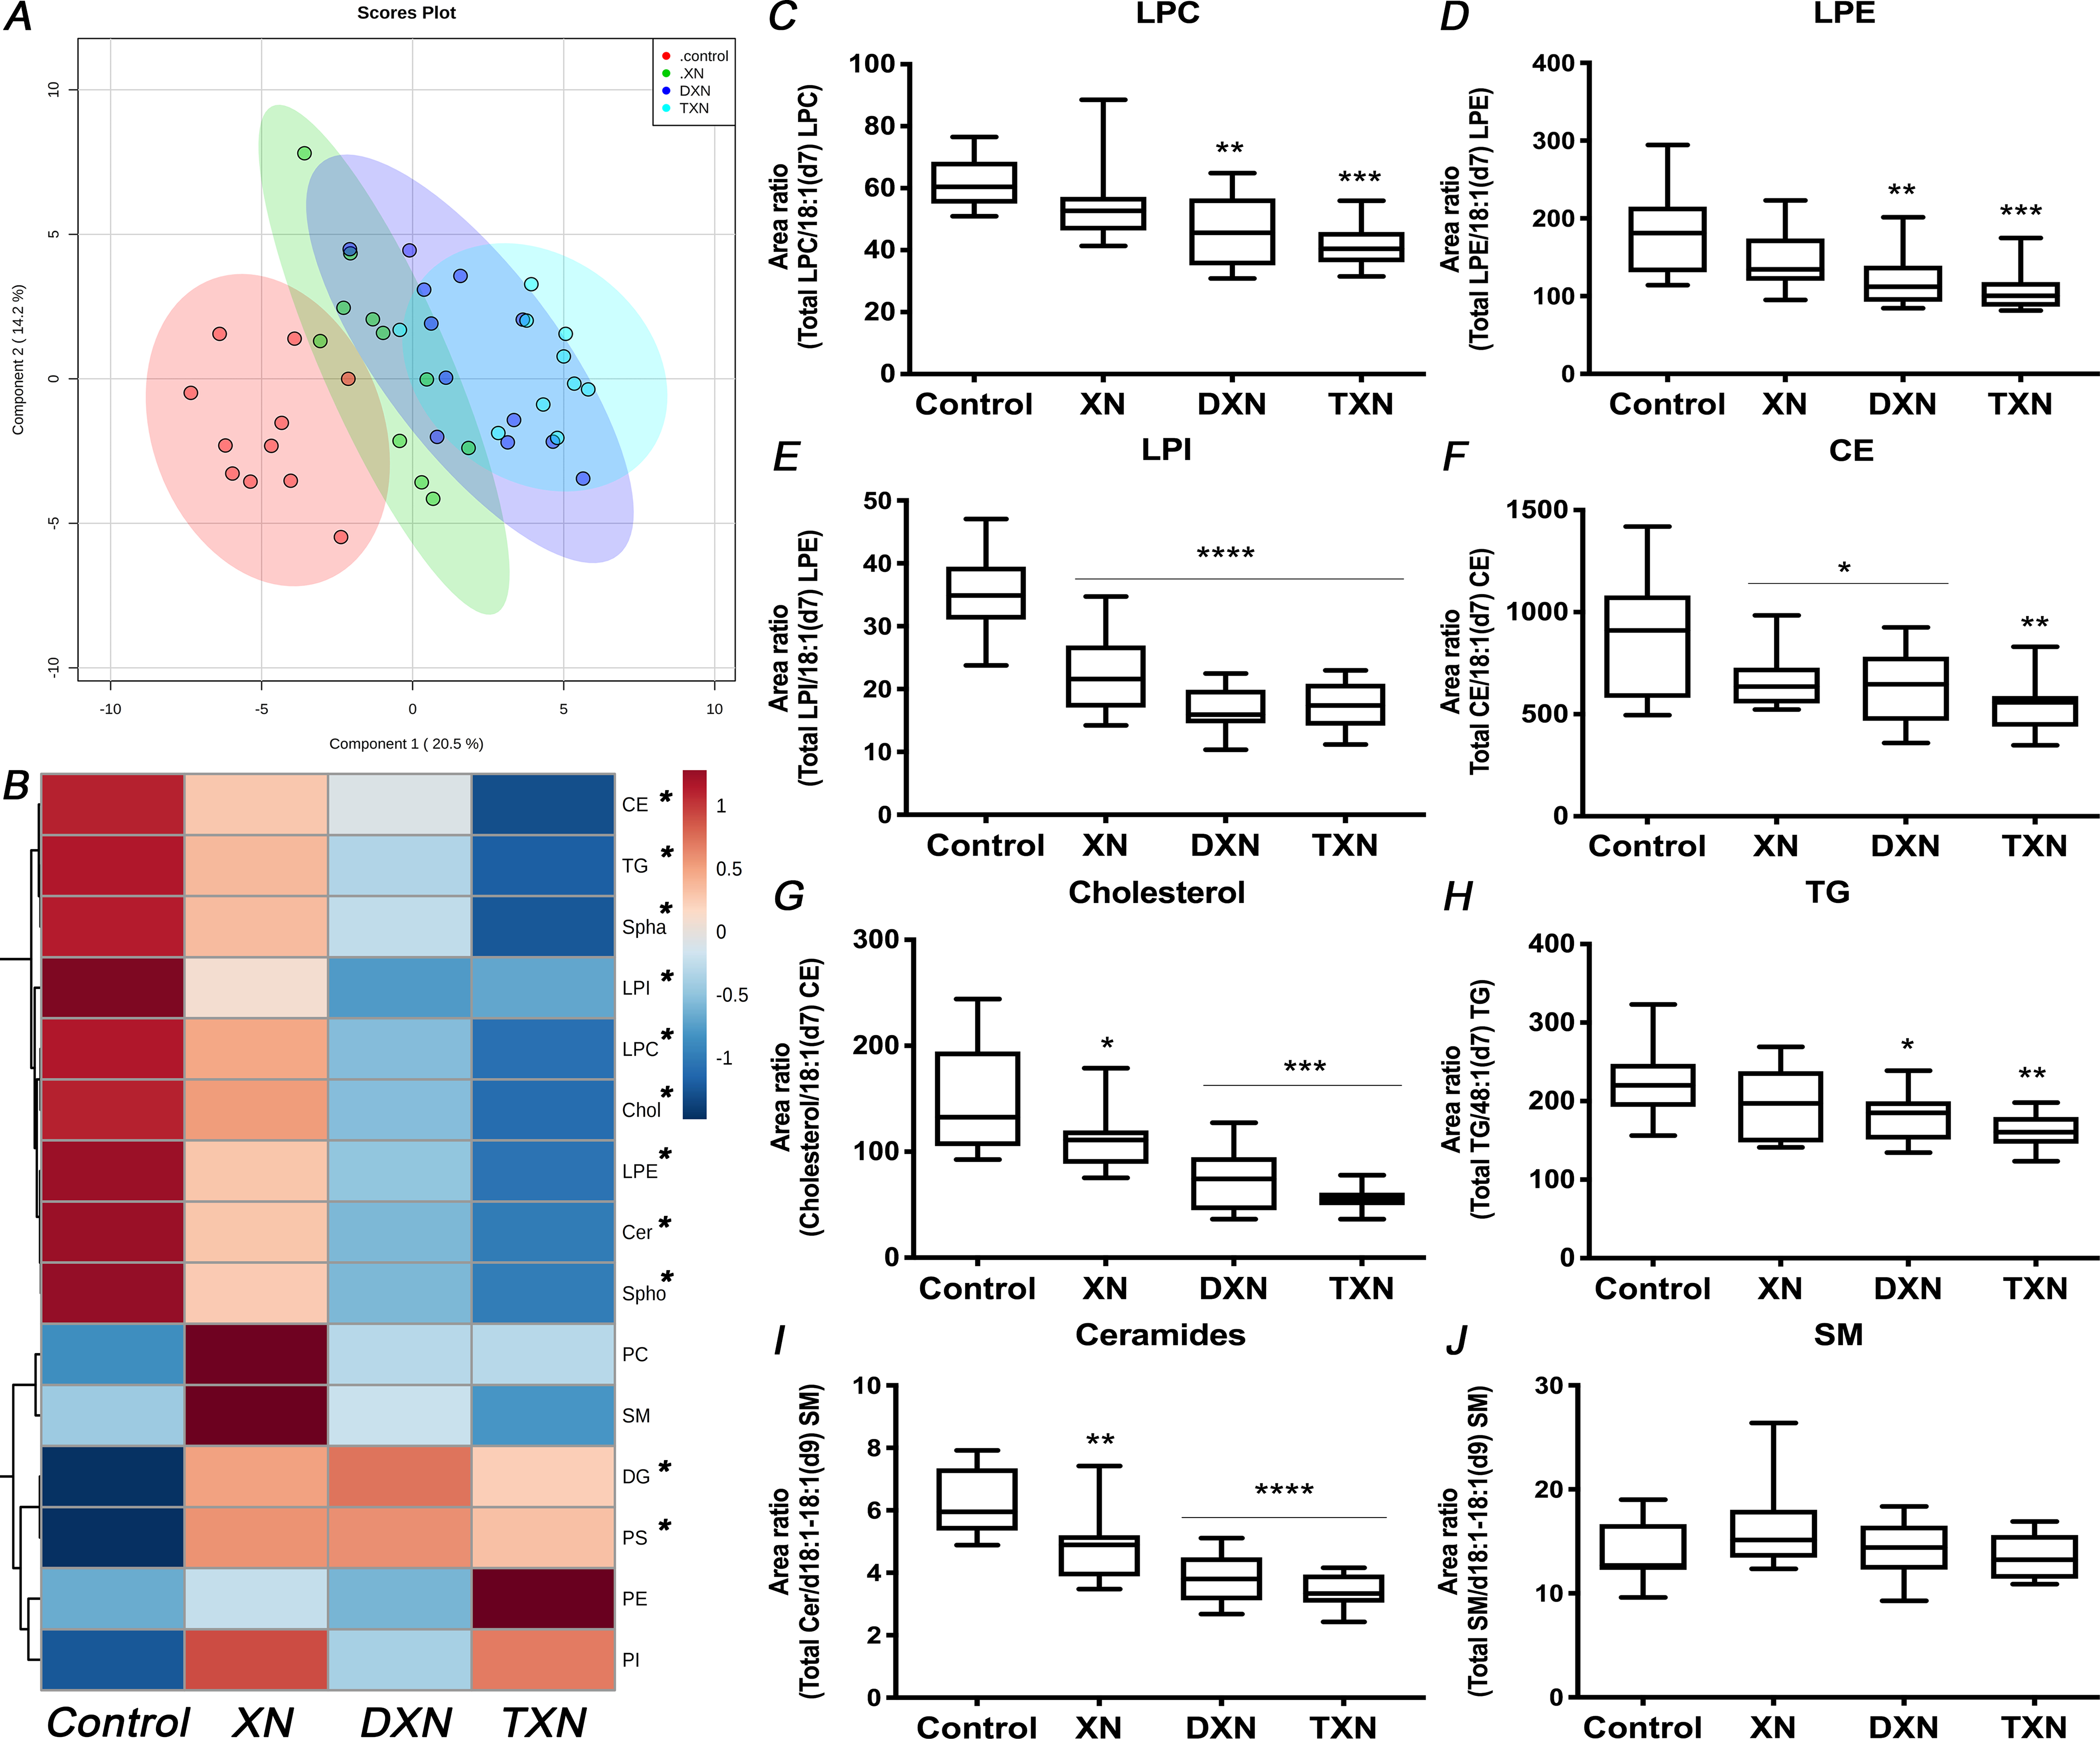
Fig. 1. XN, DXN and TXN modify hepatic lipid profiles in HFD-fed mice.

(A) Partial least-squares discriminant analysis (PLS-DA) modeling of 148 hepatic lipids in control and treatment groups. (B) Heatmap of different lipid sub-classes according to hierarchical clustering in control and treatment groups. (C-E) Hepatic lysophospholipids, (F) cholesterol esters, (G) cholesterol, (H) TG, (I) ceramides and (J) SM relative abundance (n = 9–12 per group). *p < 0.05, **p < 0.01, ***p < 0.001, ****p < 0.0001.
