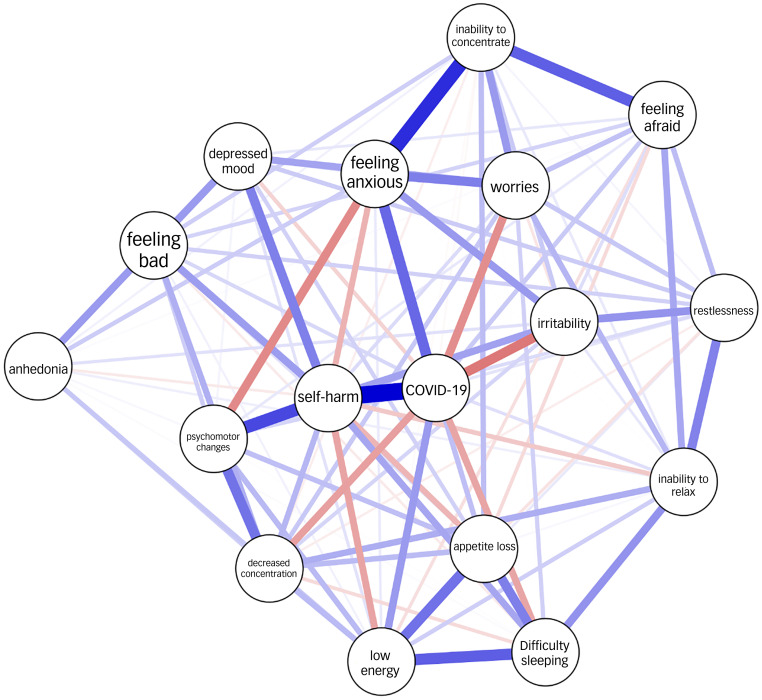
Fig. 2.
Network plots for depressive and anxiety symptoms in relation to COVID-19 status. Blue lines indicate positive correlations and red lines indicate negative correlations. The thickness of each line (or edge) represents the strength of the correlation. COVID-19 refers to COVID-19 status (positive polymerase chain reaction test result).

