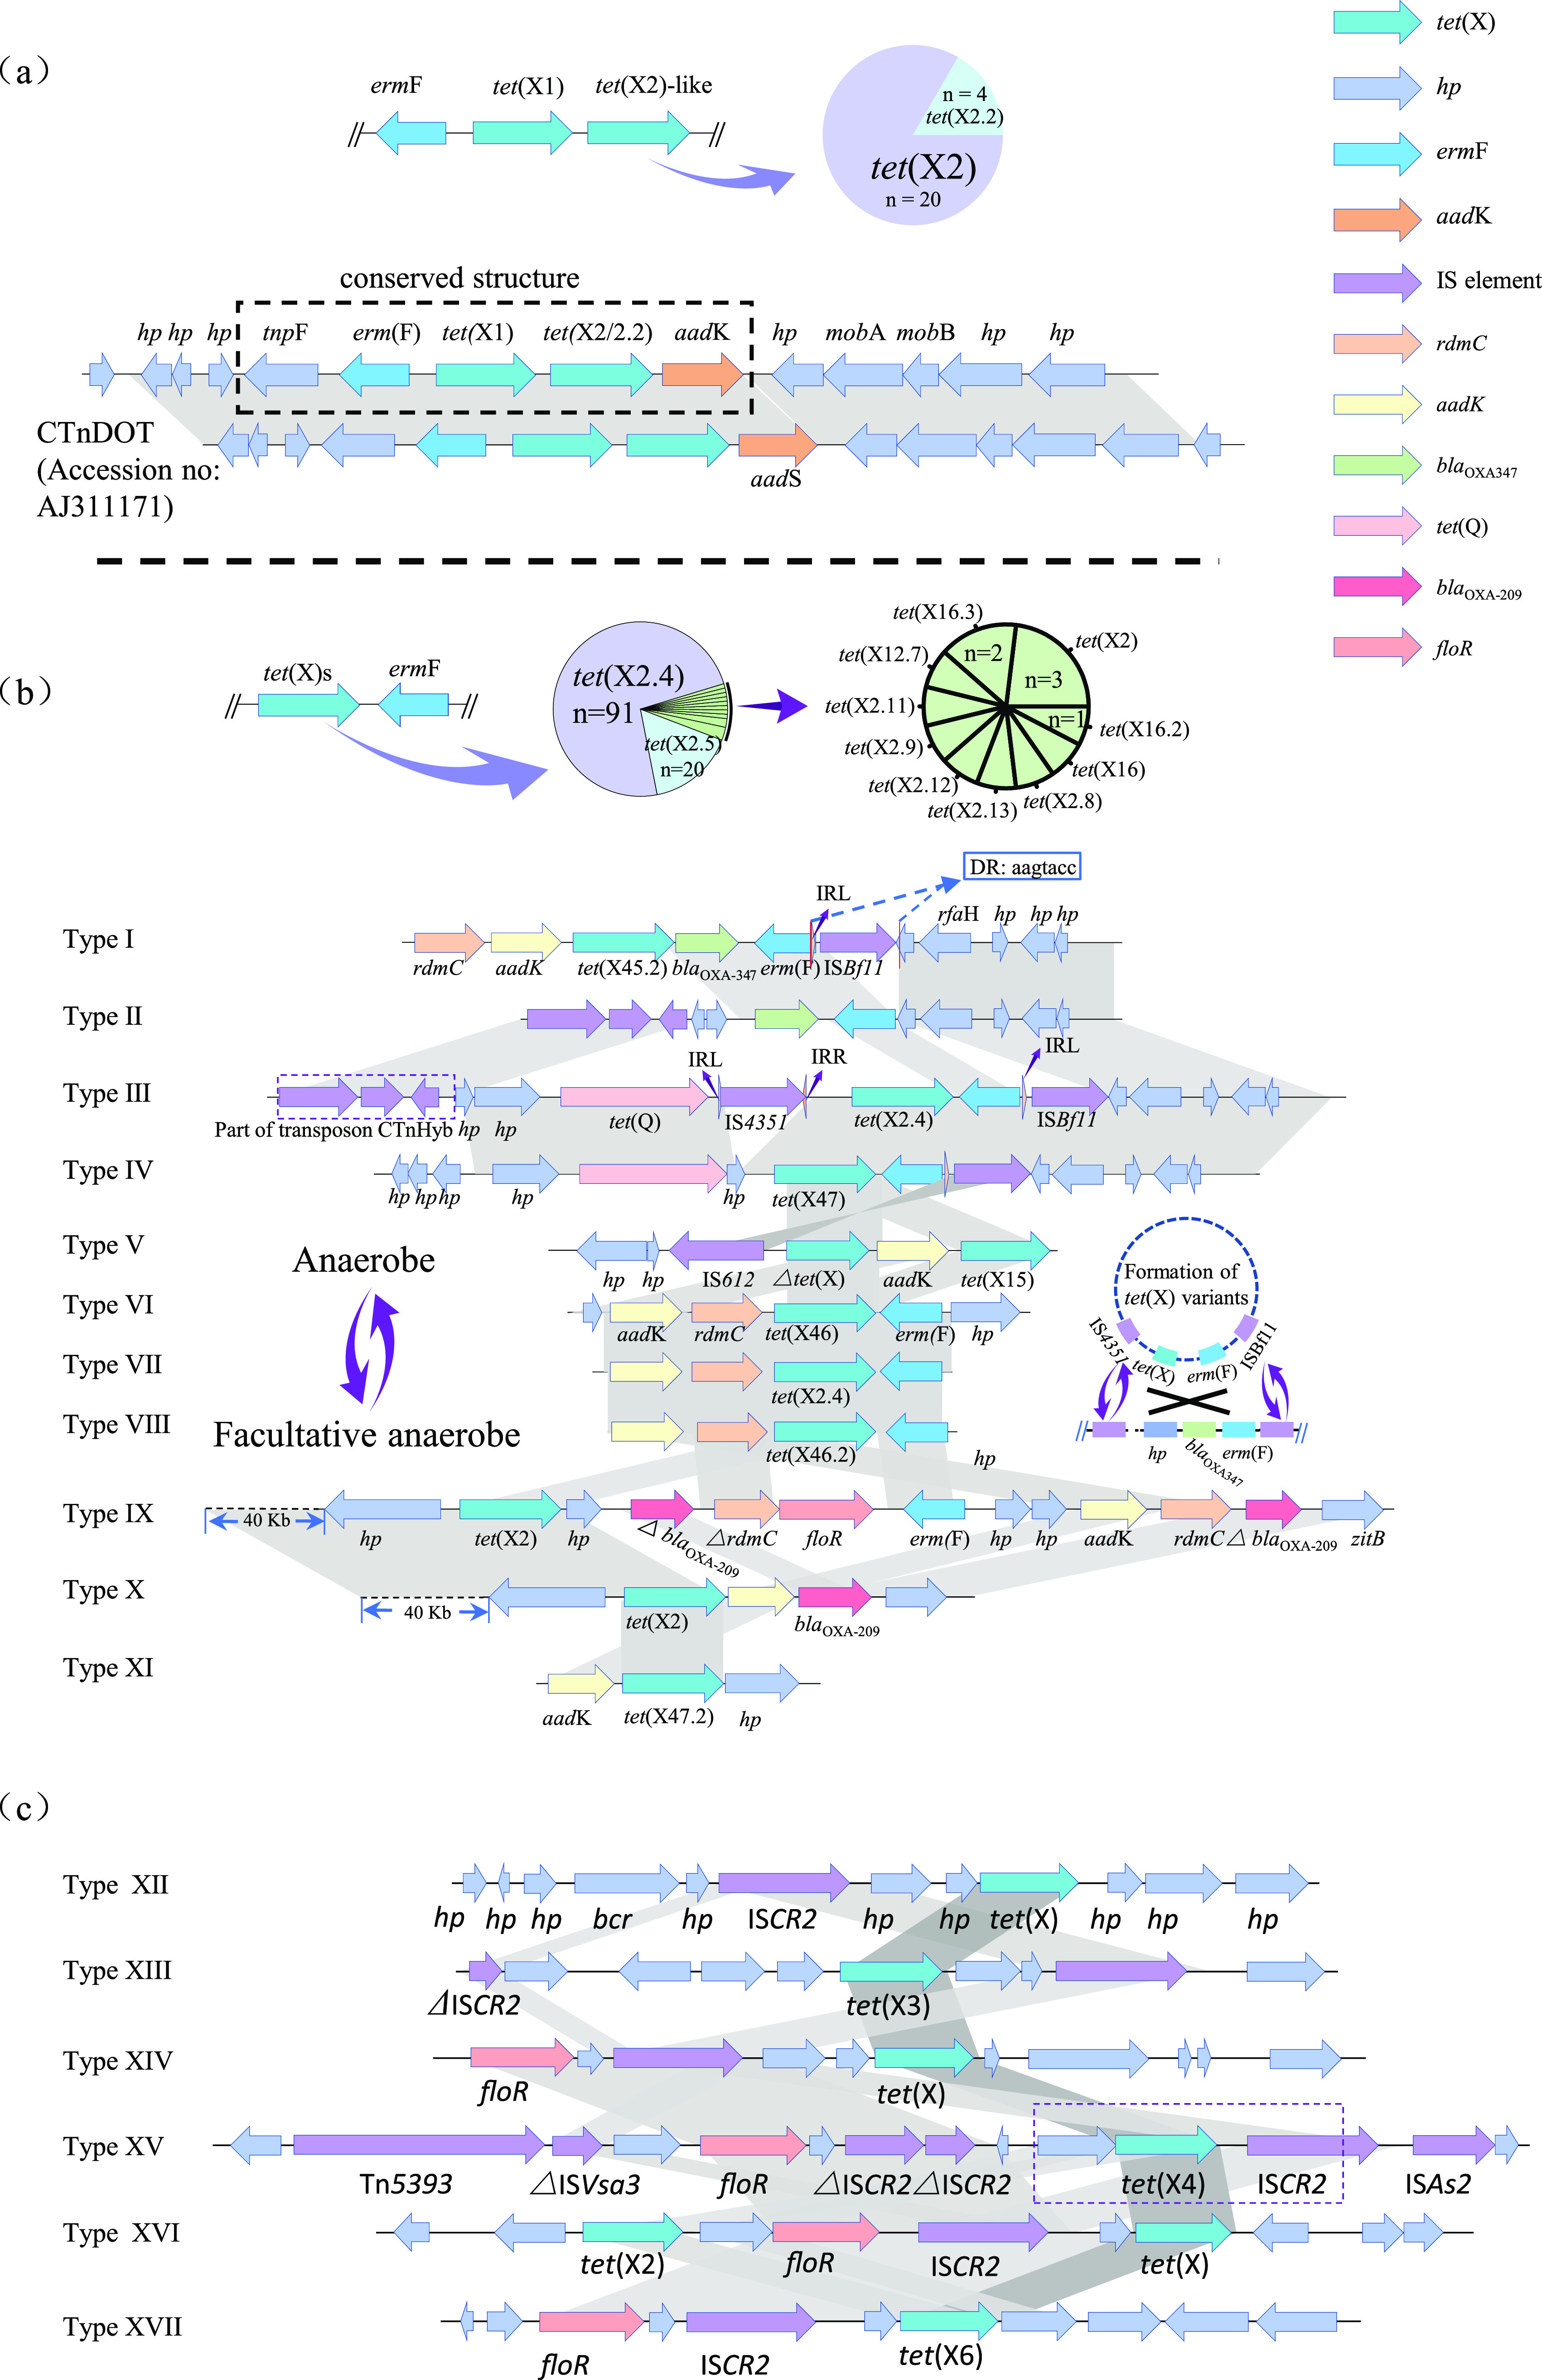
FIG 4.

Comparison of tet(X) genomic environments. (a) The genomic comparison of erm(F) gene located upstream of tet(X2)-like genes. The proportions of the tet(X2) and tet(X2.2) located downstream tet(X1) were showed in the pie chart. (b) The genomic comparison of tet(X) genes located downstream erm(F). The proportions of the tet(X) variants located downstream of erm(F) were showed in the pie chart. The possible mechanisms of non-tet(X2) formations were showed in the two circles plotted with dotted line. (c) Genomic comparison of the regions flanking tet(X3) and tet(X4) among Flavobacteriaceae, Acinetobacter and E. coli. Arrows indicate the directions of transcription of the genes, and different genes are shown in different colors. Regions of ≥ 99.0% nucleotide sequence identity are shaded light gray. Regions of 77%–91% nucleotide sequence identity are shaded dark gray. The Δ symbol indicates a truncated gene. IS, insertion sequence. See Table S11 in the supplemental material for genomic Type I–XVII definitions.
