
FIG 4.
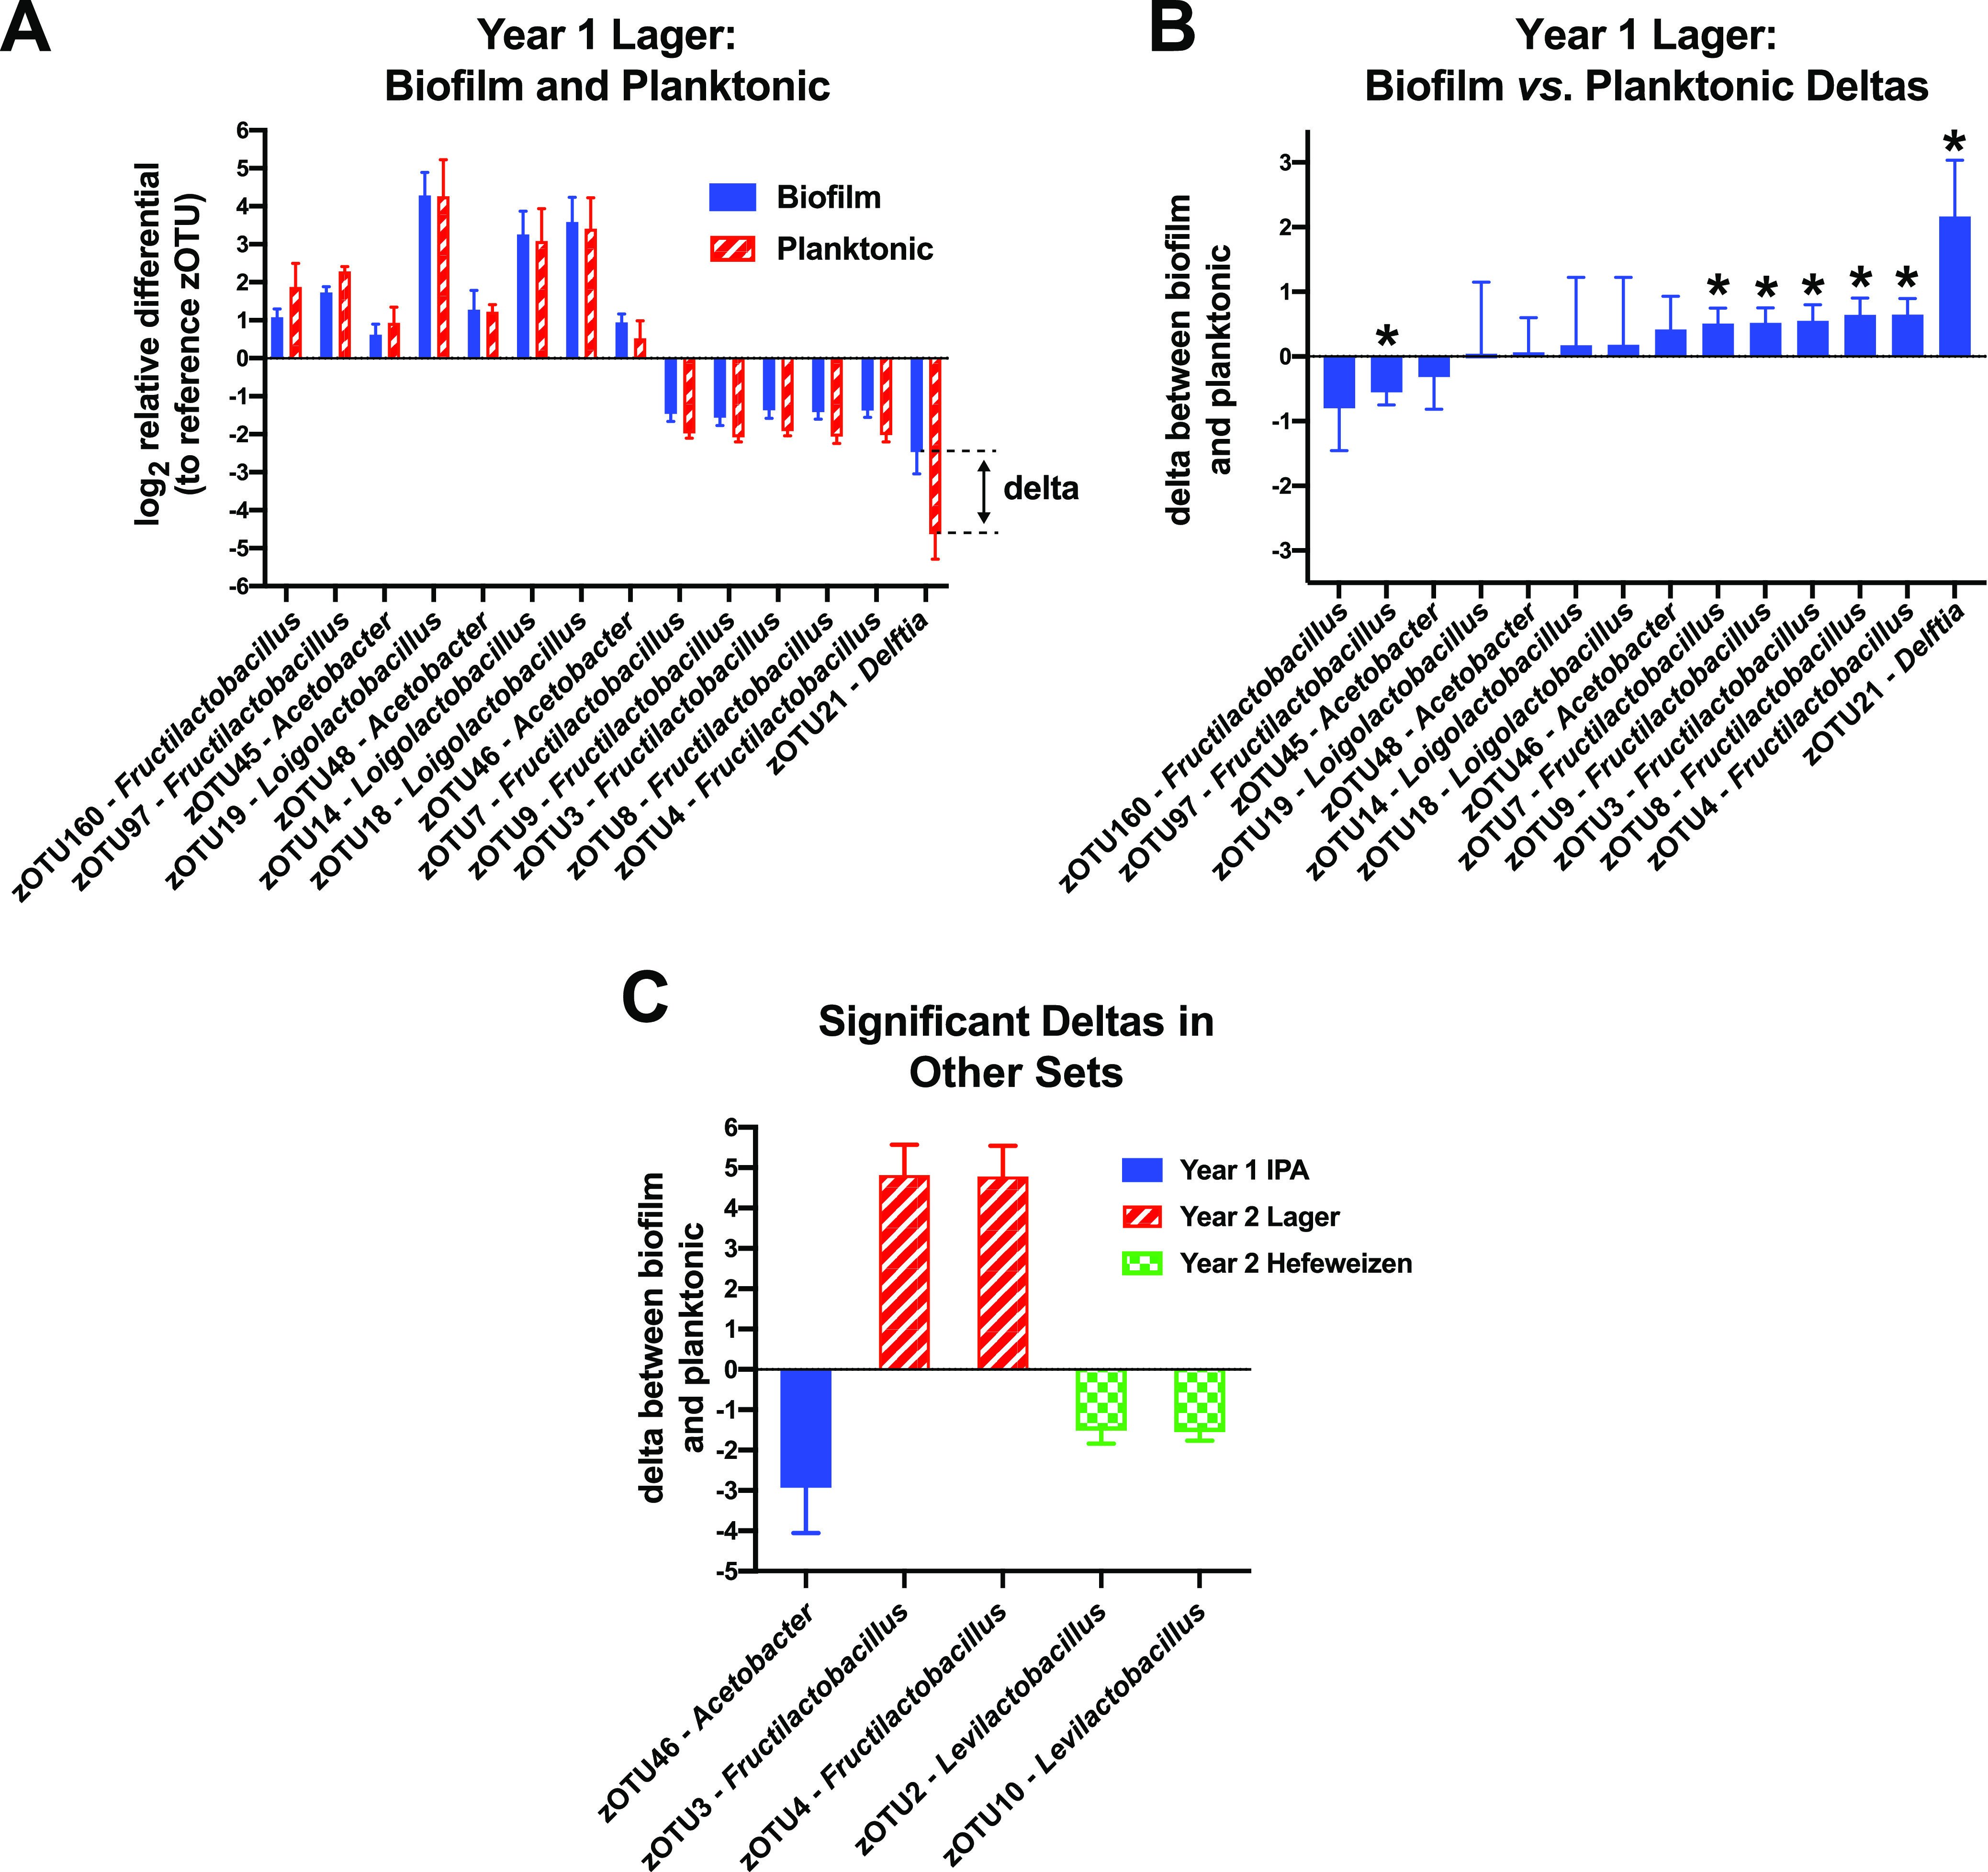
Evaluating bacterial biofilm preferences. The sequence read counts in each sample were used to calculate relative abundances with respect to a common reference sequence in each sample (zOTU1). Those ratios were then used to establish changes in their relative abundances in the incubated biofilm or planktonic communities compared to their abundances in the starter samples. (A) Bar plots of the log2 transforms of the relative differentials for bacteria in the incubated lager cultures (a 2-fold change is one unit on the ordinate axis). Error bars indicate the standard deviations between the three culture replicates. The 'delta' is the difference between the biofilm change and the planktonic change. (B) Bar plots of the deltas, with negative values indicating a preference for the planktonic niche and positive values for the biofilms in the cultured samples. Delta values from pairs that had significant differences between the biofilm and planktonic groups are marked with asterisks (t test P values <0.05). (C) Five additional significant biofilm deltas observed among the other seven culturing experiments.