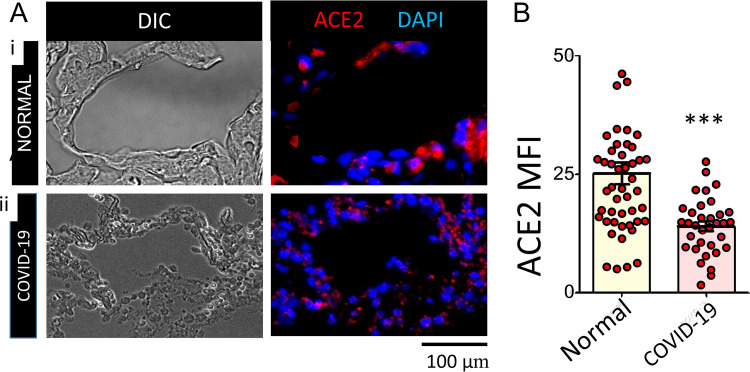
FIG 1.
Surface expression of ACE2 in normal and COVID-19 lung alveoli. (A): Representative DIC (BW), ACE2/DAPI (red/blue) epi-fluorescence microscopy images and mean fluorescence intensity (MFI) of ACE2 from indicated numbers of healthy (A-i), and SARS-CoV-2 (A-ii) lung FFPE sections shown in the upper and lower rows respectively. (B): Quantified MFI data of ACE2 levels in normal and COVID-19 lung alveoli (n = 10 + 4; ***, p < 0.001).

