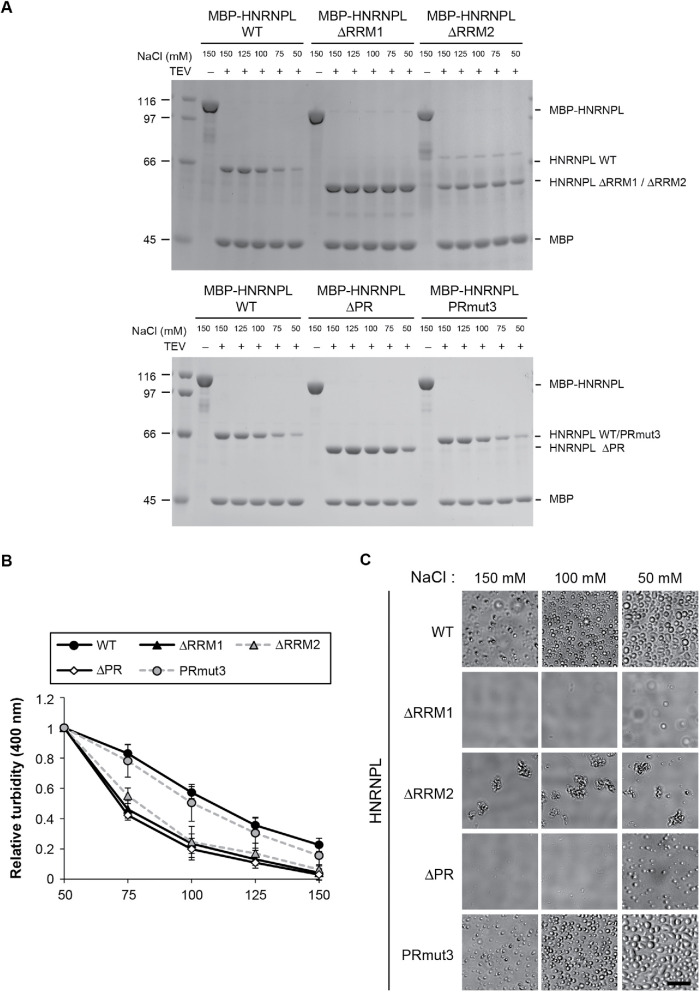
FIGURE 5:
The RRM and PR of HNRNPL contribute to phase separation. (A) Sedimentation assay with the indicated salt concentrations of HNRNPL. The presence or the absence of TEV protease is shown above the panel (“+” or “−”). The molecular mass marker (kDa) is shown on the left. (B) Turbidity assay with the indicated NaCl concentrations of HNRNPL. Mean of five independent experiments, ±SD. (C) Imaging of the indicated salt concentrations of HNRNPL. Bar, 20 μm.

