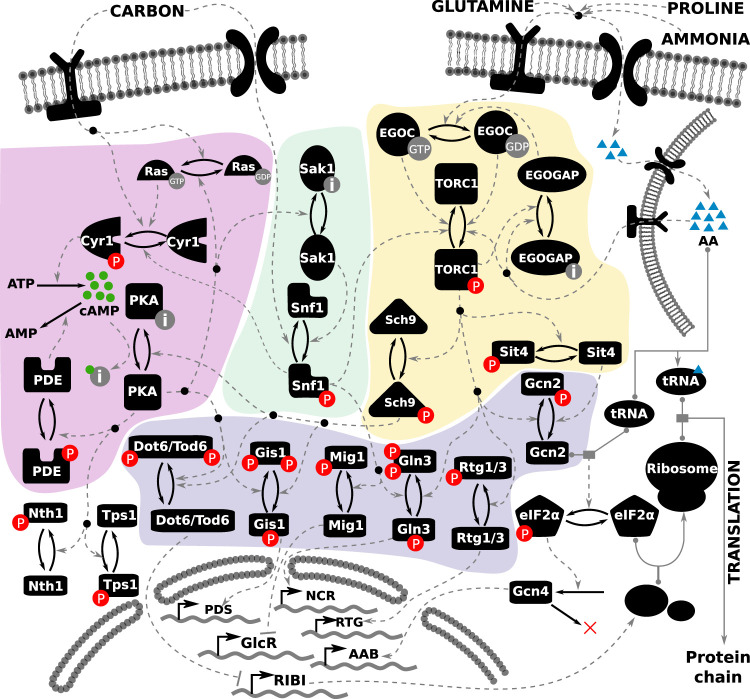
FIGURE 1:
Literature-curated molecular regulatory network of nutrient signaling in yeast cells. The cAMP-PKA pathway is depicted on the left (highlighted in purple), the Snf1 pathway in the middle (highlighted in green), and the TORC1 pathway on the right (highlighted in yellow). The readouts of the model are the activities of the transcription factors toward the bottom of the diagram (highlighted in blue), whose target genes at the bottom of the figure comprise various regulons: GlcR, glucose-repressed genes; PDS, post–diauxic shift element; NCR, nitrogen catabolite repression genes; RTG, retrograde genes; AAB, amino acid biosynthesis; and RIBI, ribosome biogenesis. Each black icon represents a molecular species. Posttranslational modifications are represented by a pair of solid arrows pointing in opposite directions. Phosphorylation is indicated by “P” in a red circle. The inactive form of a species is indicated by the letter “i” in a gray circle. Guanidylation is indicated by “GTP” in a gray circle. Regulatory signals are represented by dashed gray lines. Complex formation is indicated by a solid gray line, with the binding partners indicated by gray circles. The inputs to the model are shown at the top of the figure, represented by one carbon input, and three nitrogen inputs: glutamine, ammonia, and proline. The intracellular amino acid pool stored in the vacuole is represented by the membrane-bound structure at the top right.

