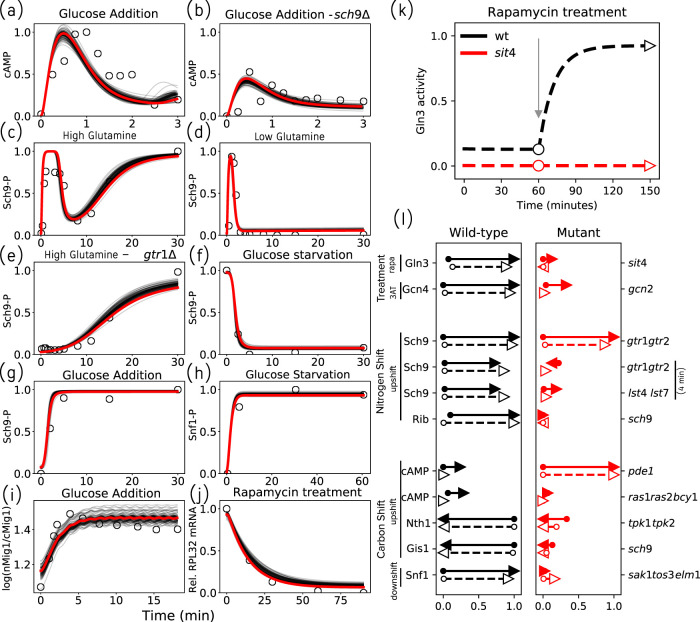
FIGURE 2:
The model successfully explains experimental data. (a–j) Time-series fits to literature-curated time-course data. The red lines represent simulated trajectories from the best-fit parameter set, while the gray lines represent simulations from 100 parameter sets with comparable sums of squared errors. The experimental measurements are shown as open circles. (a, b) Relief from glucose starvation. (c–e) Relief from nitrogen starvation by glutamine addition. (f, h) Glucose starvation. (g, i) Relief from glucose starvation. (j) Rapamycin treatment of well-nourished cells. (k) Comparing model simulations with data from a shift experiment (Beck and Hall, 1999) measuring Gln3 phosphorylation in response to rapamycin treatment in well-nourished wt and sit4Δ strains. In the wt simulation (black dashed line), we calculate the steady-state value of Gln3 in rich medium in the absence of rapamycin (black circle). Next, rapamycin is introduced (at the gray arrow), and the new, postshift steady state is recorded (black triangle). The same simulation was repeated for sit4Δ cells to yield preshift (red circle) and postshift (red triangle) steady states. (l) Visualization of perturbation analyses. The perturbations are drug treatments or nutrient shifts carried out in wt cells (left column, black arrows) and mutant strains (right column, red arrows). The labels on the left indicate the molecular species being assayed, and the labels on the far right indicate the gene(s) deleted in the mutant strains. Experimental results are represented by solid arrows and model simulations by dashed arrows. For each molecular species under consideration, the arrow’s tail and head indicate (respectively) the pre- and postperturbation steady-state values, as measured on the relative scale (0–1) at the bottom of the column. As an example, the rapamycin treatment in panel k is reproduced in the first line of panel l. Note that the y-axis in panel k is now the x-axis in panel l.

