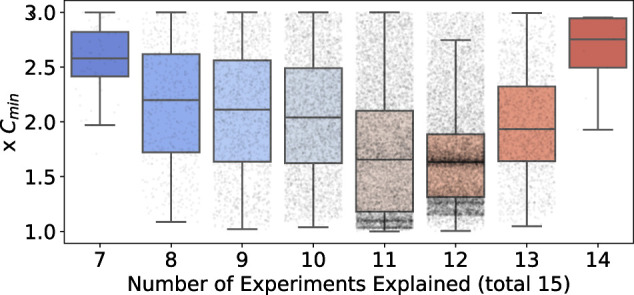
FIGURE 3:

Dependence of model cost on explanatory capacity, across the entire collection of 18,000 alternative sets of parameter values. Model predictions of the 15 qualitative phenotype experiments were repeated for the collection of acceptable parameter sets. Each boxplot shows the distribution of cost-of-fit (to the quantitative measurements) for a given level of explanatory capacity (i.e., the number of qualitative phenotypes explained). Each point represents a parameter set. The cost, on the y-axis, is reported as a multiple of Cmin, the best observed cost across all parameter sets. The boxplot shows the median cost, and the whiskers extend to 1.5 times the interquartile range (IQR), or the last data point less than 1.5×IQR. Note that only parameter sets with a cost less than or equal to twice the Cmin are reported.
