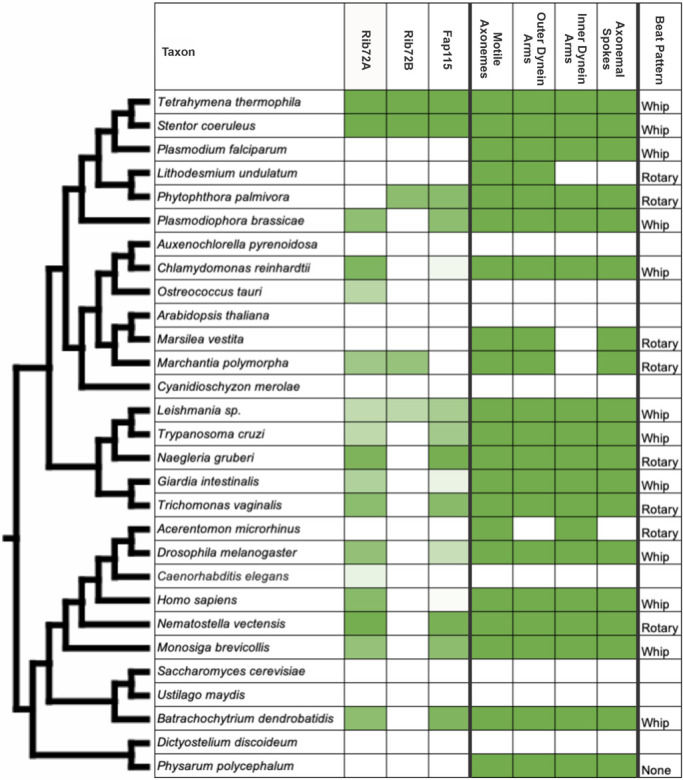
FIGURE 2:

Homology assessment and motile cilia molecular components among a panel of eukaryotes. Homology for Rib72A, Rib72B and Fap115 is based on BLASTp results using Tetrahymena thermophila as the query. The degree of green shading is based on the E-value (log10 scaled) ranging from the lightest green (Caenorhabditis elegans E-value = 5.0 × 10⁻¹⁹) to the darkest green (Stentor coeruleus E-value = 1 × 10–120). The presence of motile cilia structural components for each organism is found on the right and indicated by solid green shading. Beat patterns are briefly described (except where beat pattern was unavailable = blank).
