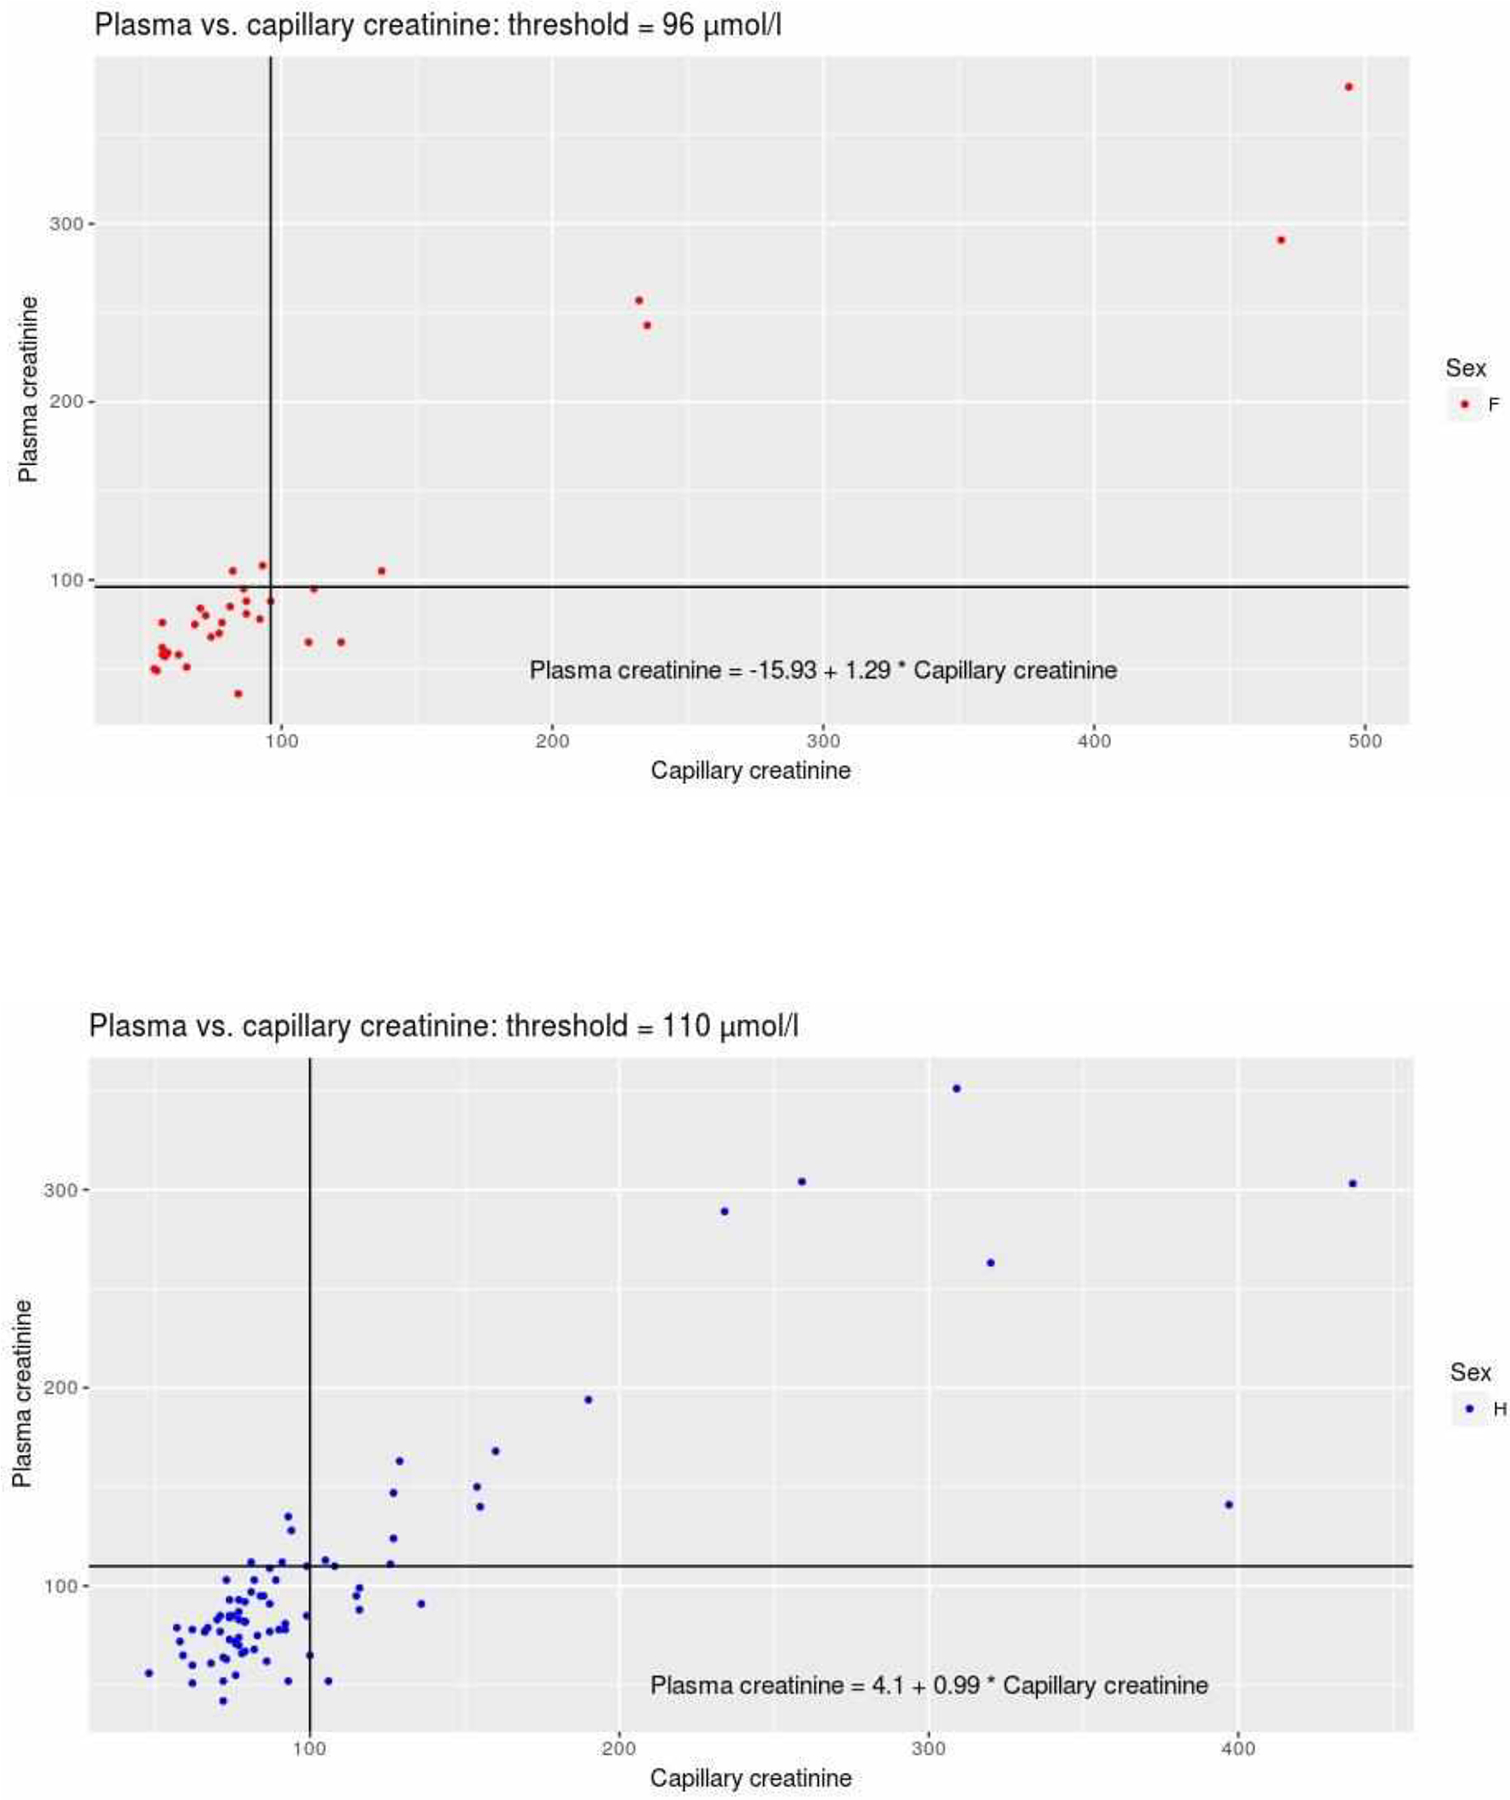
Figure 1:

A. Correlation between Ccap(μmol/l) and Cpl(μmol/l) in women(n=30). The horizontal and vertical lines represent the threshold for definition of the true positive (i.e. 96 μmol/L for women). B. Correlation between Ccap(μmol/l) and Cpl(μmol/l) in men (n=80). The horizontal and vertical lines represent the threshold for definition of the true positive (i.e. 110 μmol/l for men).
