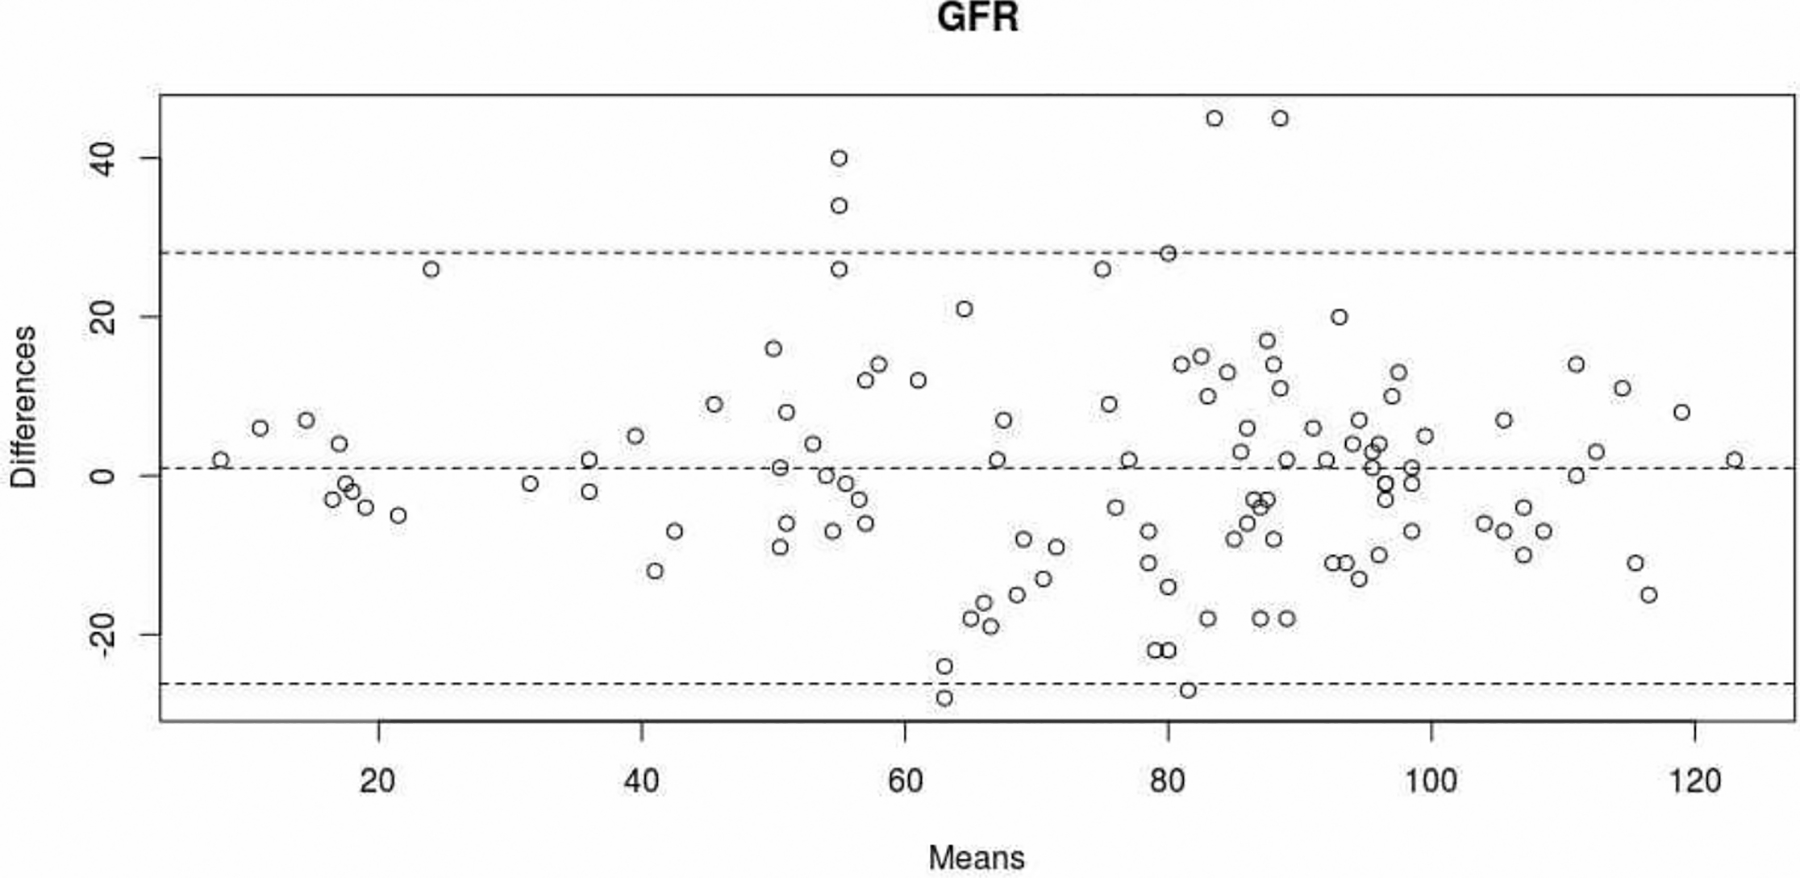
Figure 4:

Level of agreement between eGFRcap and eGFRpl (Bland-Altman plot). The dotted lines correspond to the mean [95%CI] for the difference between eGFRcap and eGFRpl).

Level of agreement between eGFRcap and eGFRpl (Bland-Altman plot). The dotted lines correspond to the mean [95%CI] for the difference between eGFRcap and eGFRpl).