FIGURE 7:
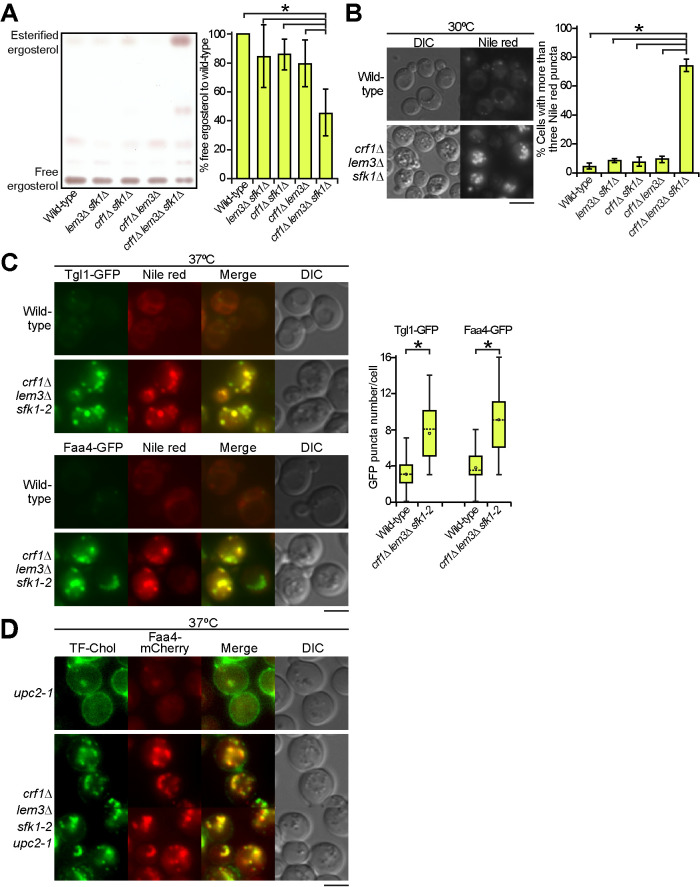
LDs were increased in the crf1∆ lem3∆ sfk1 triple mutants. (A) TLC analysis of total sterols. Ergosterol contents were analyzed by TLC as described in Materials and Methods. Right panel: the percentage of free ergosterol relative to that of the wild type was determined and is expressed as the mean ± SD derived from the analysis of six independent samples. An asterisk indicates a significant difference, as determined by the Tukey–Kramer test (p < 0.05). (B) Increase in Nile red–positive puncta in the crf1∆ lem3∆ sfk1∆ triple mutant. Cells were cultured in YPDA medium to mid–log phase at 30°C, followed by Nile red staining. Nile red staining was performed as described in Materials and Methods. Right panel: the percentage of cells with more than three Nile red puncta was determined and is expressed as the mean ± SD of three independent experiments (n > 315 cells in total for each strain). An asterisk indicates a significant difference, as determined by the Tukey–Kramer test (p < 0.05). (C) Increase in LD marker (Tgl1-GFP and Faa4-GFP)-containing structures in the crf1∆ lem3∆ sfk1-2 triple mutant. Cells were cultured as in Figure 2E, followed by Nile red staining. Right panel: the Tgl1-GFP or Faa4-GFP puncta were counted in a single focal plane of each cell and are expressed with boxplots (whiskers: maximum and minimum values; box: first quartile, median, and third quartile; circle: average). The numbers of cells analyzed were 51 and 50 (wild type) and 53 and 51 (triple mutant) for Tgl1-GFP and Faa4-GFP, respectively. Asterisks indicate a significant difference, as determined by a two-tailed Student’s t test (p < 0.05). (D) Colocalization of TF-Chol puncta with Faa4-mCherry in the crf1∆ lem3∆ sfk1-2 upc2-1 mutant. Cells were cultured as in Figure 2E, except that YPDA medium containing TF-Chol was used. Bars, 5 µm.

