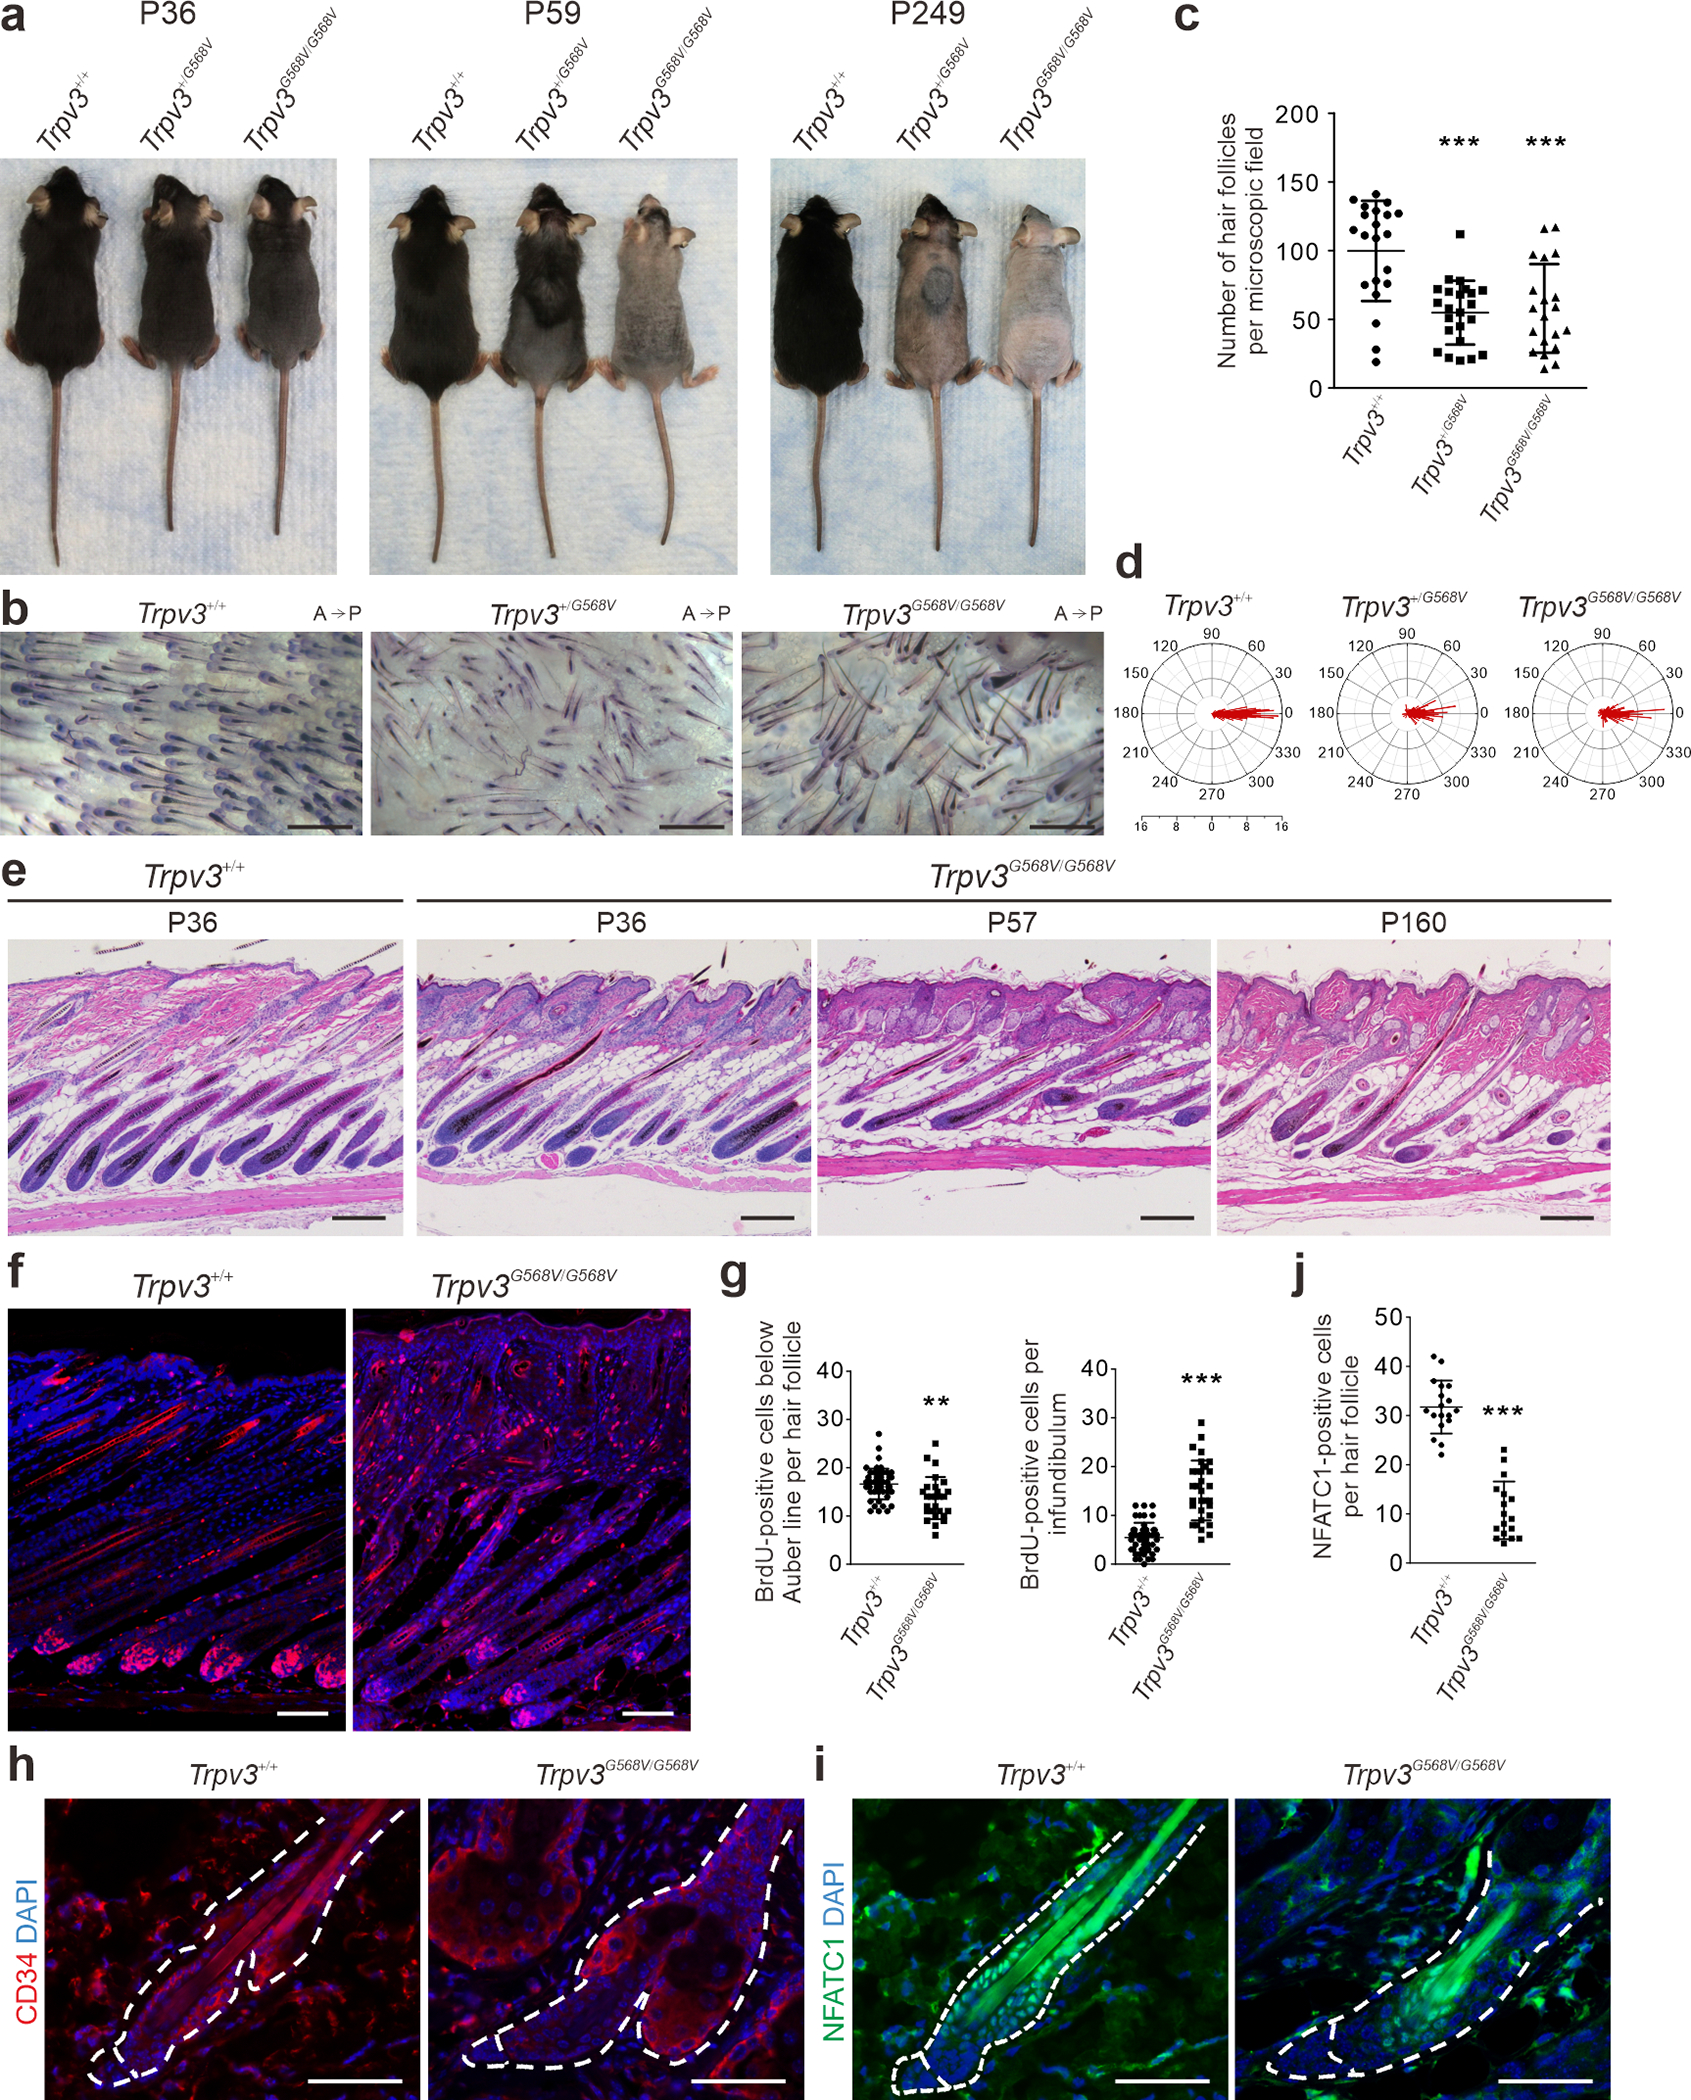
Figure 6. Impaired hair regeneration in Trpv3 knock-in mice.

(a) Appearance at indicated age. (b - d) Alkaline phosphatase staining of dorsal skins of P249 littermates (b), and quantification of hair follicle density (c) and anterioposterior orientation (d). A, anterior. P, posterior. Radial axis represents the number of hair follicle in that specific angle. n = 4 mice per genotype and ≥ 20 microscopic fields per genotype were examined. Number of hair follicles evaluated: Trpv3+/+, 278; Trpv3+/G568V, 262; Trpv3G568V/G568V, 283. Data are presented as mean ± SD. *** P < 0.001 (One-way ANOVA analysis was followed by Dunnett’s Multiple Comparison Test). (e) Histology of dorsal skins at indicated postnatal days. (f - g) BrdU labeling and quantification in P12 littermates. n = 5 mice per genotype and ≥ 27 hair follicles per genotype were examined. Data are presented as mean ± SD. *** P < 0.001, ** P < 0.05 (Two-tailed Student’s unpaired t test). (h - j) Immunofluorescence labeling of CD34 (h) and NFATC1 (i), and quantification (j) in P48 littermates. n = 3 mice per genotype and ≥ 17 hair follicles per genotype were examined. Data are presented as mean ± SD. *** P < 0.001 (Two-tailed Student’s unpaired t test). Scale bar = 500 μm (b), 200 μm (e), 100 μm (f), 50 μm (h - i).
