Fig. 3.
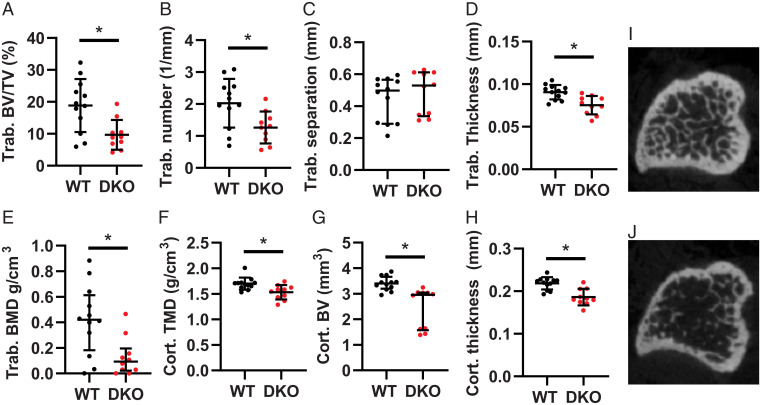
Cldn2/12 DKO mice have altered bone morphometry at 3 mo. Microarchitecture of trabecular (trab) (A–E) and cortical (cort) (F–H) bone from tibia of WT and Cldn2/12 DKO mice analyzed by micro-CT. (A) Trabecular bone volume/tissue volume (P = 0.006). (B) Trabecular number (P = 0.014). (C) Trabecular separation (P = 0.228). (D) Trabecular thickness (P = 0.001). (E) Trabecular bone mineral density (P = 0.014). (F) Cortical tissue mineral density (P = 0.006). (G) Cortical bone volume (P = 0.0001). (H) Cortical thickness (P = 0.0003). Representative micro-CT images of the tibial metaphyses shown at 40 slices from growth plate from WT (I) and DKO (J) mice. Data are presented as mean ± SD compared by unpaired t test (A, B, D, G, and H) or as median (IQR) compared by Mann–Whitney U test (C, E, and F). *P < 0.05.

