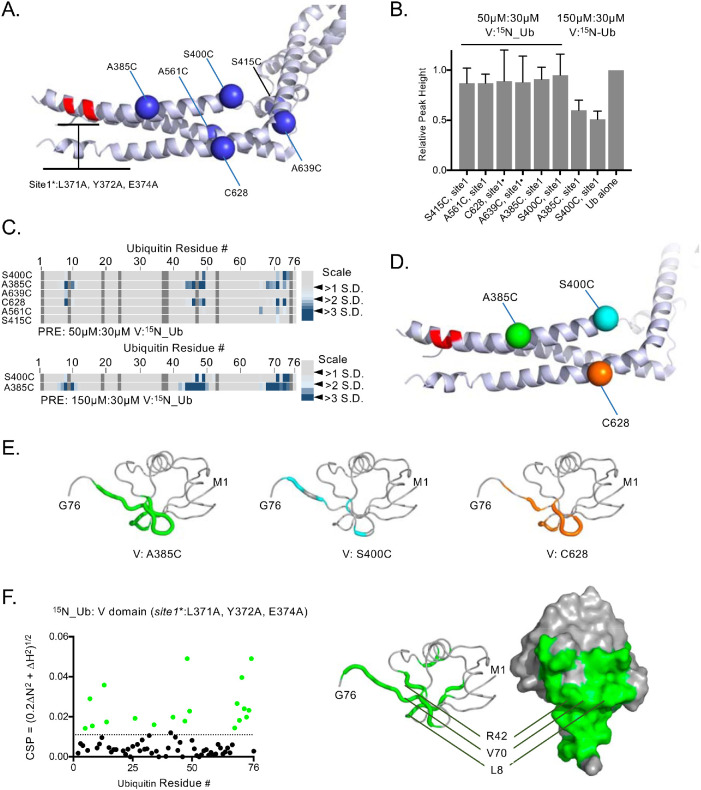
FIGURE 4:
Mapping a second Ub-binding site. (A) Position of single-amino-acid replacement mutations comprising a set of single cysteine–containing VHDPTP variants in the context of inactivated Ub-binding Site1. (B) Relative average HSQC peak heights (±SD) of all residues of 30 µM 15N-Ub HSQC spectra alone or in the presence of 50 or 150 µM HD-PTP variant proteins. (C) Spin-labeled single cysteine–containing V domain variants lacking Site1 Ub binding were incubated with 15N-Ub at the indicated ratios in the absence and presence of reduction by ascorbate. PRE effects, measured by change in ratio of peak intensity before and after reduction, are plotted by an increase in color intensity indicating those that were 2–4 SDs from the mean change. (D) Highlighted in green, cyan, and orange are positions giving maximal PRE on 15N-Ubin the absence of Site1. (E) Backbone amides of Ub undergoing largest PRE effects (>2 SD above the mean) when bound to HD-PTP spin labeled at residues indicated in D. (F) Left, HSQC data of 15N-Ub (30 mM) in the presence of (150 µM) the HD-PTP V domain lacking the Site1 Ub-binding site. The magnitudes of chemical shift perturbations ([0.2∆N2 + ∆H2]1/2) are plotted for each assignable backbone amide of Ub. Dashed line indicates level chemical shift perturbation 1 SD above the mean. Right, Residues undergoing significant chemical shift perturbations in F are plotted onto Ub structure (PDB: 1UBQ).

