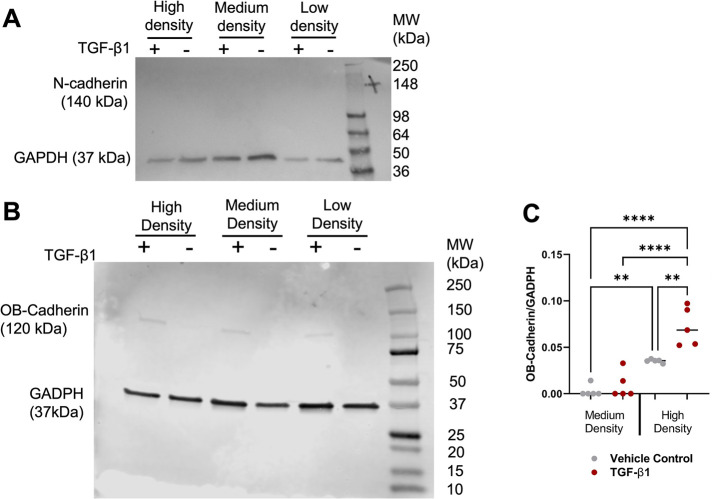
FIGURE 6:
OB-cadherin expression is elevated in HLFs at high cell density. (A) Representative Western blot of N-cadherin. (B) Representative Western blot of OB-cadherin. (C) Quantification of OB-cadherin Western blots. Each dot in the dot plot represents one Western blot value and the center lines represent the median values. *p < 0.05, **p < 0.01, ***p < 0.001.

