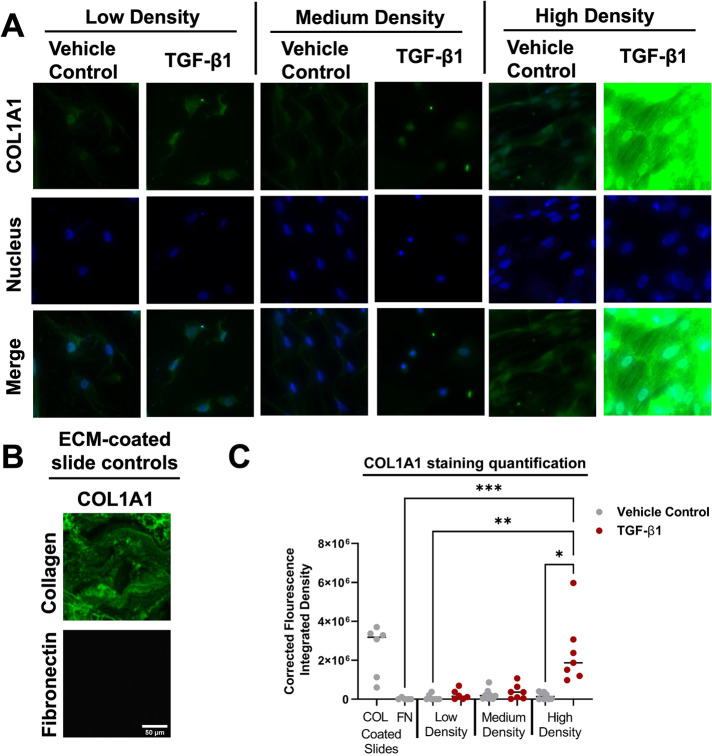
FIGURE 7:
High-density HLFs deposit treated with TGF-β1 deposit more collagen matrix. (A) Representative immunostained images of COL1A1 (green) and the nucleus (blue). (B) Representative images of COL1A1 staining for collagen-coated and fibronectin-coated slides. Scale bar on fibronectin-coated slide image represents 10 µm and applies to all images in panels A and B. (C) Fluorescence integrated density values from immunostaining images. Each dot in the dot plot represents the mean value of one sample and the center lines represent the median values. *p < 0.05, **p < 0.01, ***p < 0.001.

