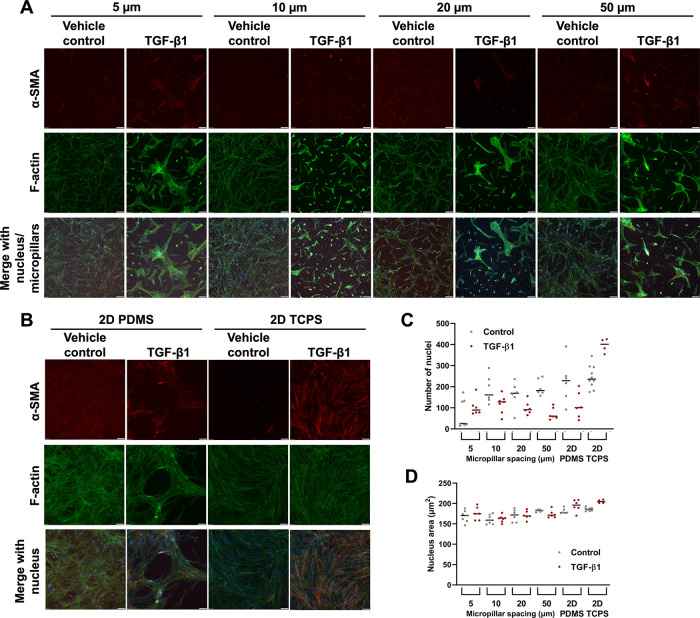
FIGURE 9:
HLFs do not alter α-SMA expression with increasing confinement in a microfabricated micropillar system. Representative images of HLFs fixed and stained for α-SMA (red), f-actin (green), and the nucleus (blue), for cells (A) in microchannels or (B) on 2D PDMS or TCPS. Scale bars represent 50 µm. Also shown are dot plots for (C) mean number of nuclei per image and (D) mean nuclear area for conditions represented in images in panels A and B. Each dot in the dot plot represents the mean value of one image (data pooled from three independent experiments) and the center lines represent the median values. Full statistical comparison tables for panels C and D are provided in Supplemental Tables S2 and S3.

