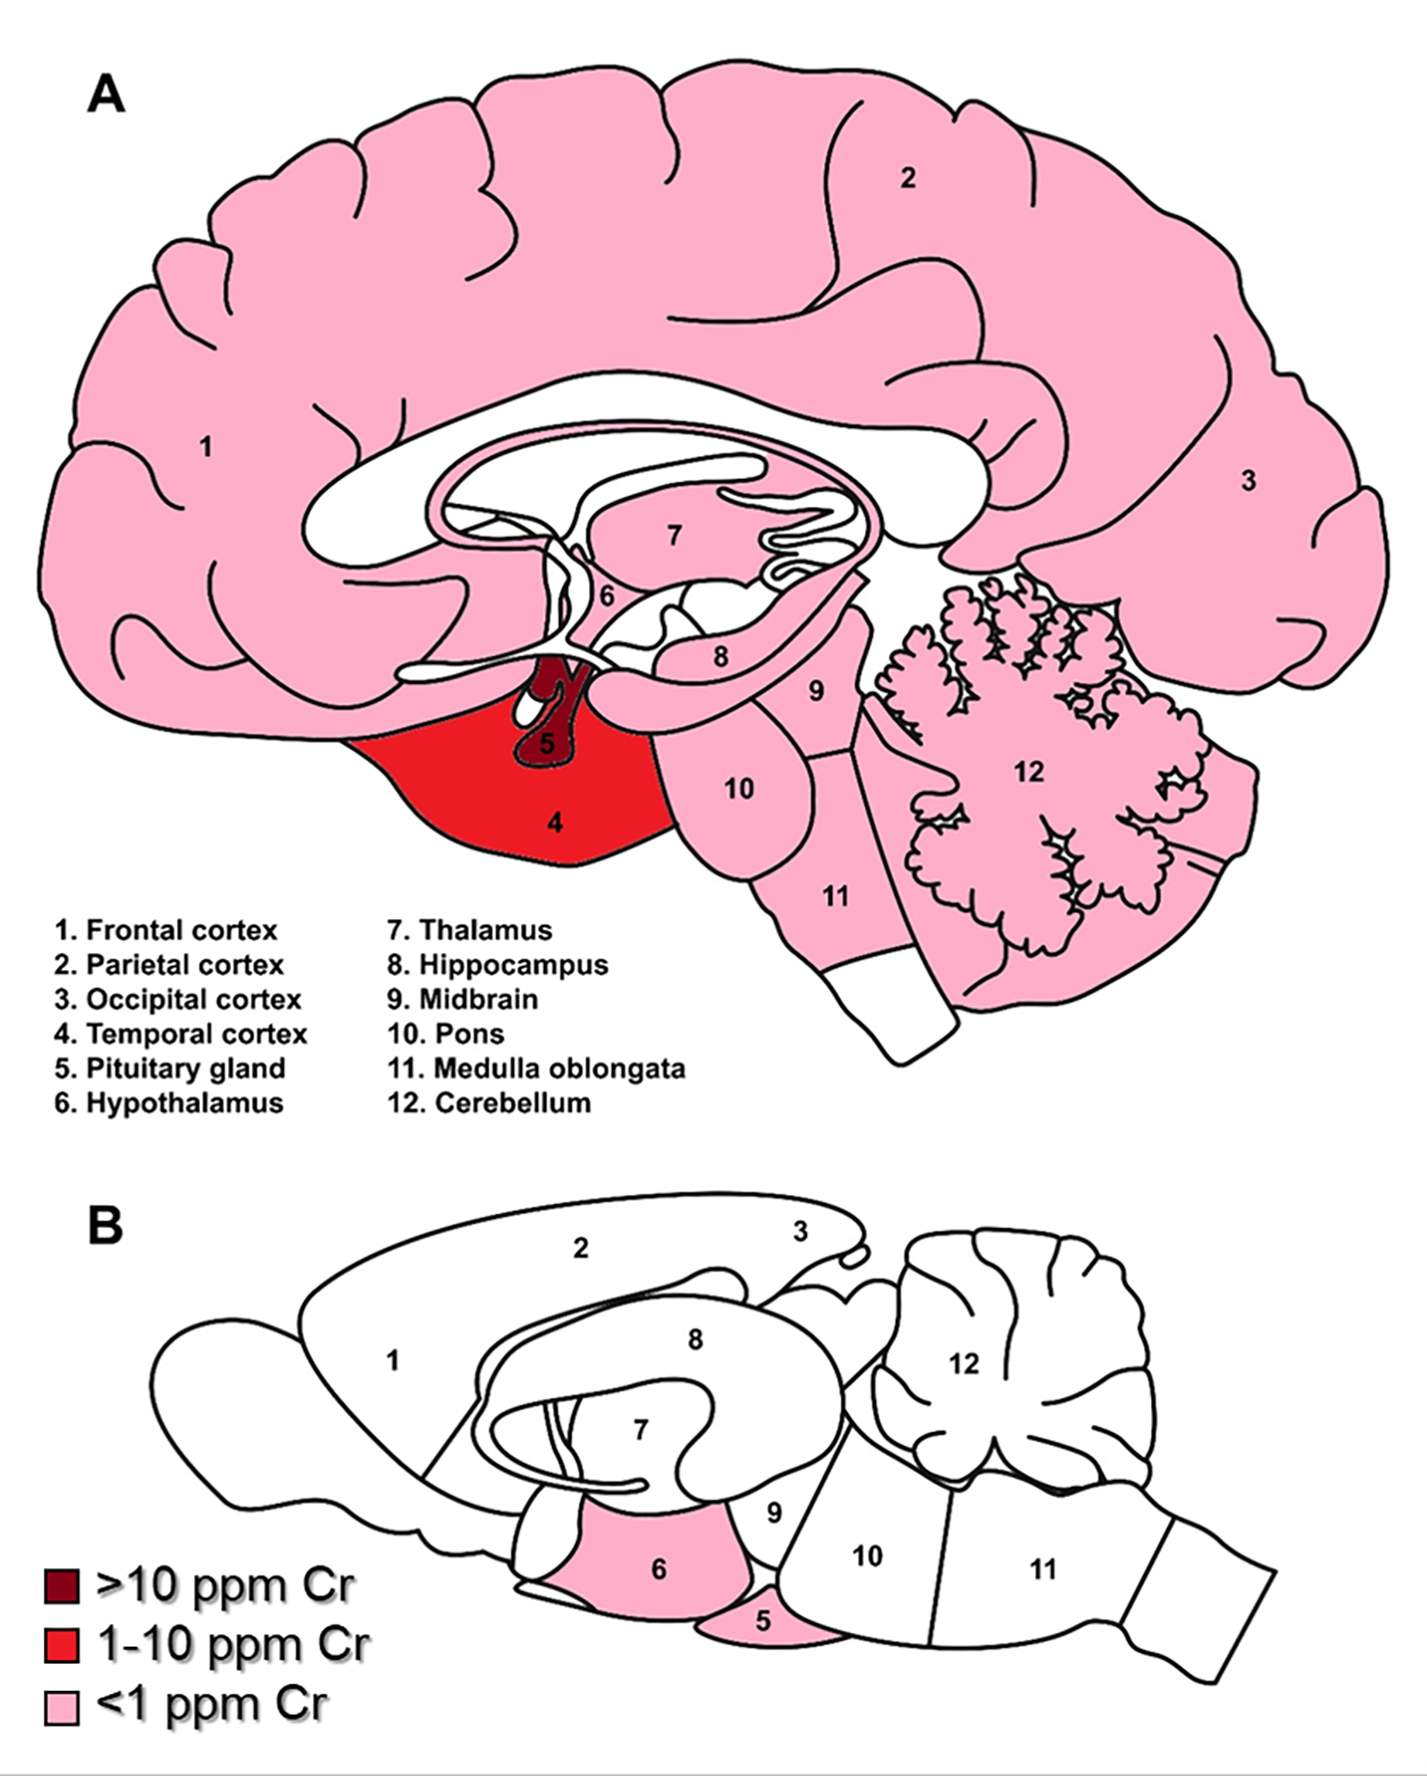
Figure 1. Relative distribution of reported Cr deposition in human (A) and rodent (B) brains.

Dark red indicates Cr levels greater than 100 μg/g; red = 10–100 μg/g; pink indicates less than 1 μg/g; white areas indicate no data reported. NB: most rodent studies measured whole brain Cr, thus there is limited data for regional Cr deposition.
