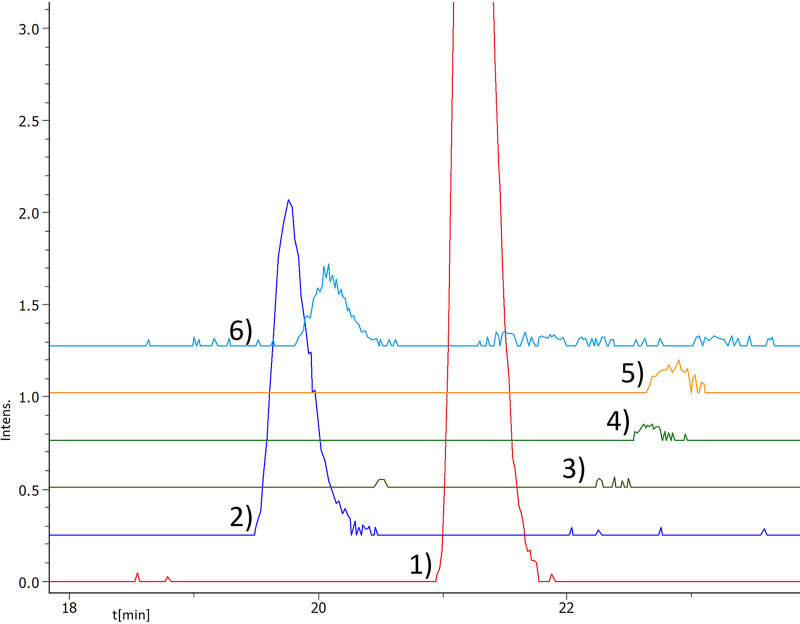
FIG 2.
Extracted ion chromatograms (EICs, calcd. [M + 2H]2+ ± 0.01 Da) of darobactin analogs. Depicted are DAR B (trace 2, 525.2512 m/z), C (trace 3, 484.2065 m/z), D (trace 4, 497.7119 m/z), E (trace 5, 470.2034 m/z), and F (trace 6, 487.2482 m/z), with DAR A (trace 1, 483.7089 m/z) as the control, showing the creation of these derivatives by mutasynthesis. Chromatogram traces have an offset. Complete chromatograms are given in Fig. S2.

