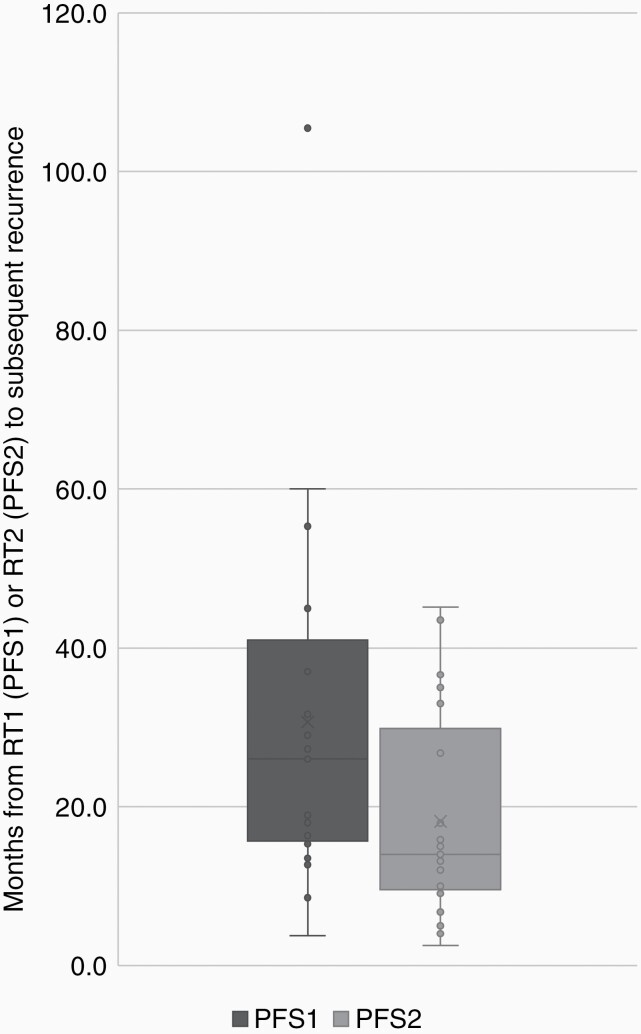
Figure 4.
Progression free survival after RT1 and RT2 in patients with post-RT2 failure (P = 0.029). The boxes represent the first and third quartiles; the dark horizontal lines show medians, whiskers represent range (with outliers shown as points). PFS1 = PFS after first course of fractionated radiotherapy to recurrence after RT1; PFS2 = PFS after second course of fractionated radiotherapy to recurrence after RT2.

