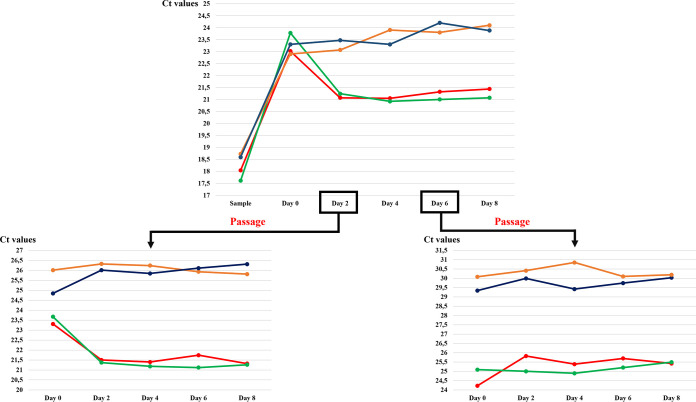
FIG 2.
Graphic representation showing (top) the CT variations of Saccharibacteria between each coculture condition tested in this study, (bottom left) the CT variations of each coculture condition after first passage at day 2, and (bottom right) the CT variations of each coculture condition after first passage at day 6. The coculture of the first sputum sample with Schaalia odontolytica is represented in red, and the second one is represented in green. For the cocultures with Streptomyces strains, the anaerobic conditions are indicated in blue, and the aerobic conditions in orange.

