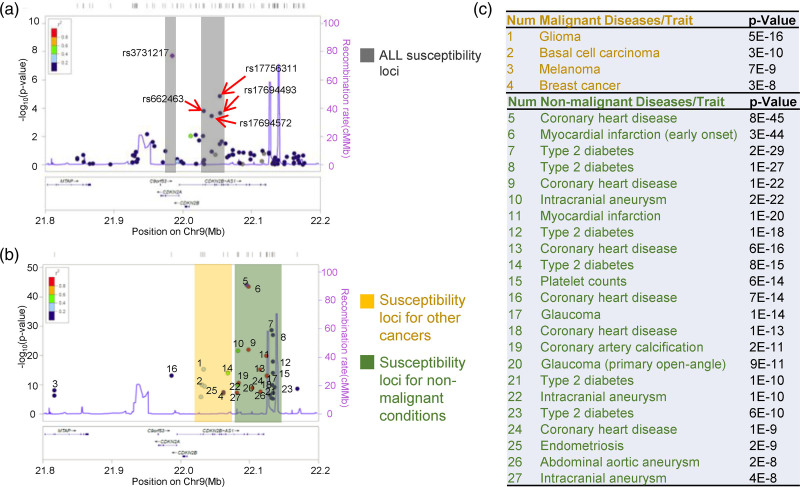
Fig. 1.
GWAS Catalog associations for CDKN2A/2B loci plotted across Ch9:21.8–22.2 MB. Association results [−log10(P value)] for ALL susceptibility loci (a), susceptibility loci of other cancers, and susceptibility loci of nonmalignant conditions (b) are depicted with regards to the physical location of SNPs. (c) Lists of SNPs plotted in (b). SNP, single nucleotide polymorphism.

