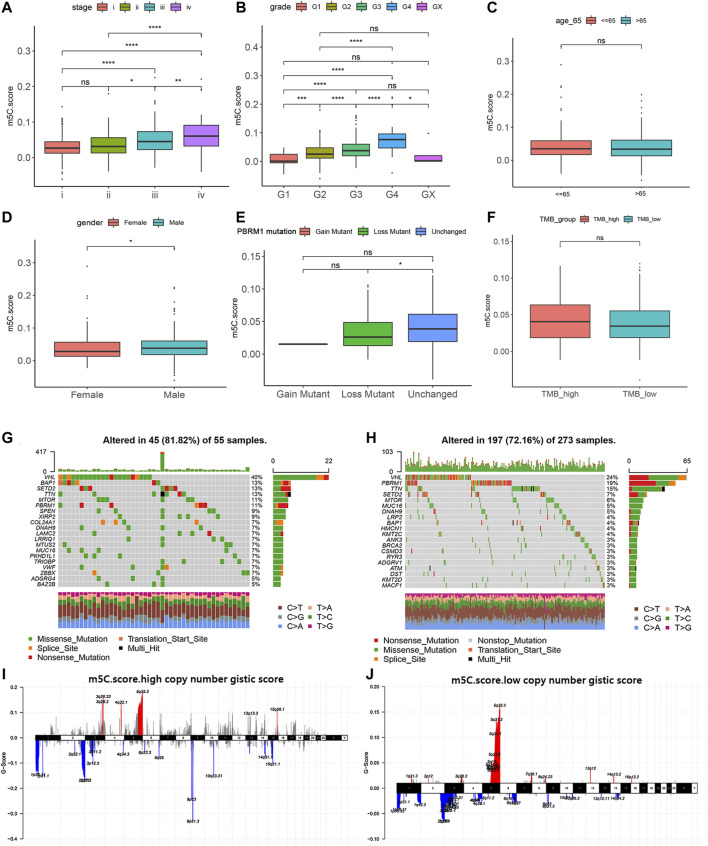
FIGURE 7.
Relation of m5C modification with clinicopathological features and tumor somatic mutation. (A–F) Associations of m5C score with stage, grade, age, gender, PBRM1 mutation status, and TMB in TCGA cohort. (G–H) Landscapes of somatic variants of high and low m5C score groups in TCGA cohort. (I–J) Copy number variants of high and low m5C score groups in TCGA cohort.

