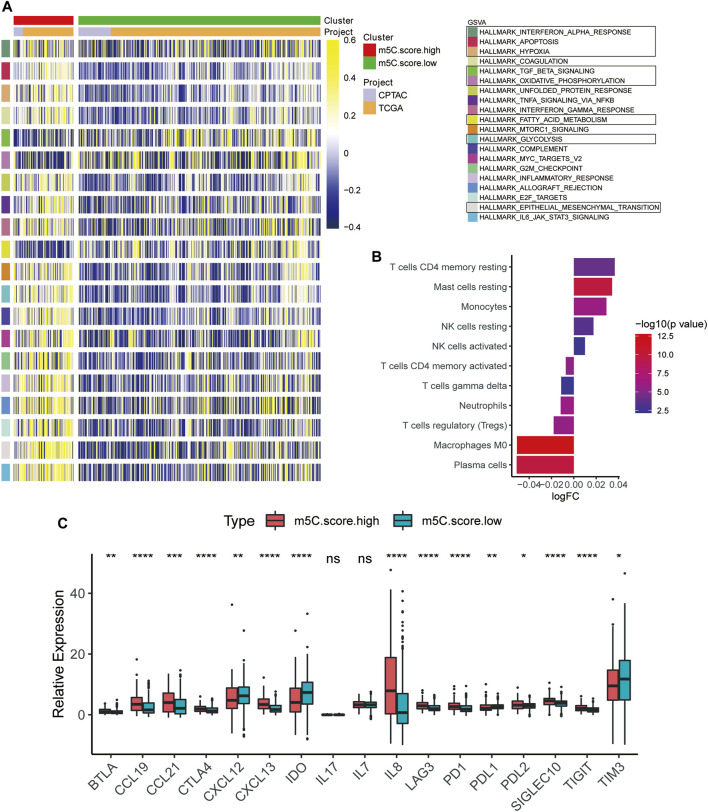
FIGURE 8.
Characteristics of TME and immune cell distribution in m5C-related phenotypes. (A) GSVA results of high and low m5C score groups based on expression profiles from CPTAC and TCGA cohorts. (B) Estimation of immune cell infiltration in high and low m5C score groups. (C) Expression levels of chemokines, cytokines, and immune checkpoints between high and low m5C score groups.

