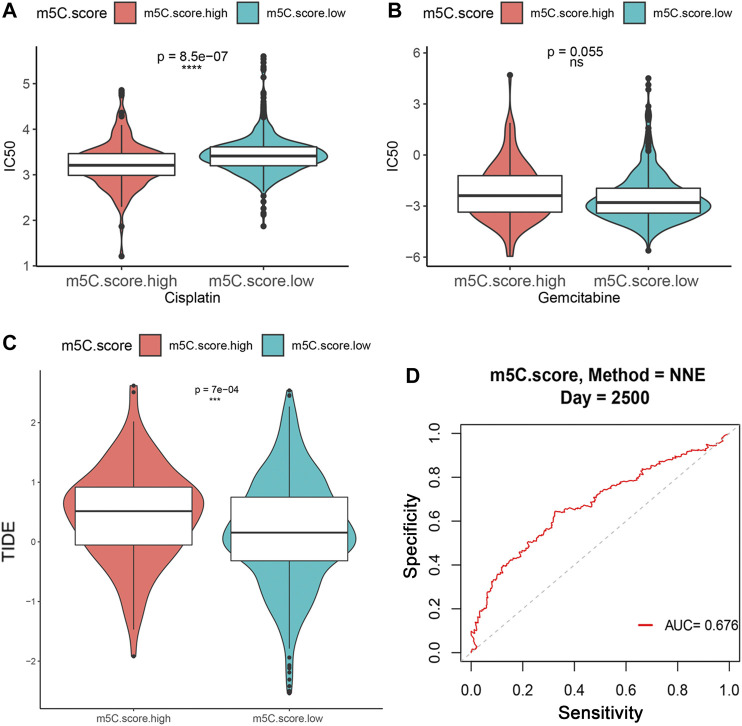
FIGURE 9.
Influence of m5C modification patterns on chemotherapy and immunotherapy response. (A–B) IC50 value for cisplatin and gemcitabine in low and high m5C score groups. (C) TIDE prediction score of low and high m5C score groups. (D) ROC curve for evaluating the ability of m5C score to predict immunotherapy response.

