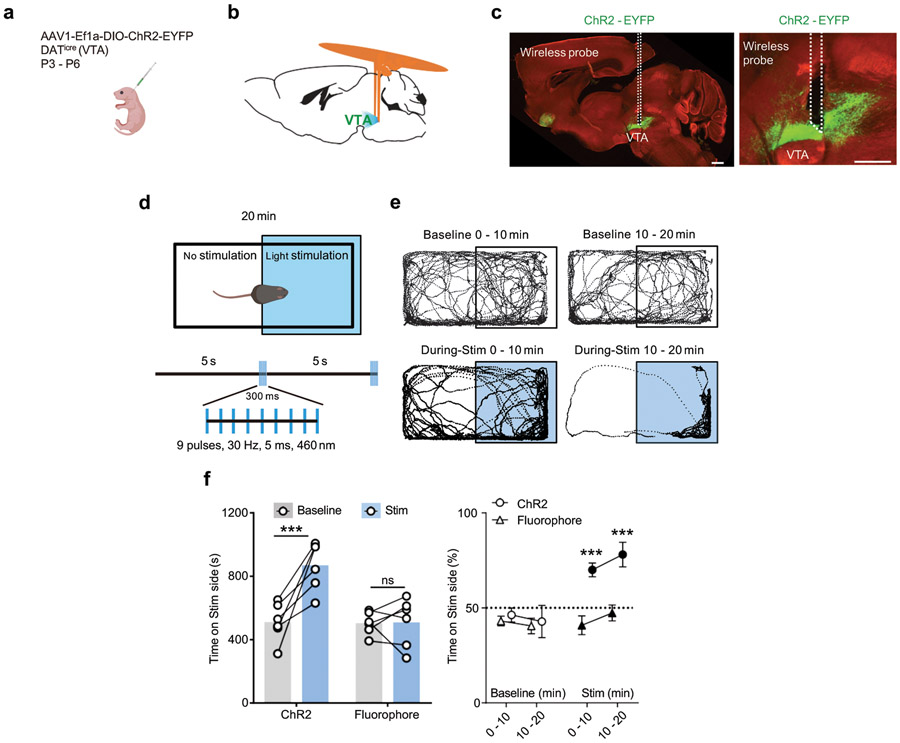
Extended Data Figure 8. Bilateral burst wireless stimulation of midbrain dopaminergic neurons regulates place preference.
a, Schematic illustration of neonatal virus transduction in DATicre animals. b, Schematic image of implanted position of bilateral wireless device posterior to the VTA. c, Left: sagittal brain section showing the expression of ChR2.EYFP in the VTA and the track of wireless probe. Right: Close up image of the VTA. Scale bar: 500 μm. d, Top: schematic showing the arena of real-time place preference (RTPP) and the stimulation area (blue). Bottom: burst pattern of wireless optogenetic stimulation. e, Example traces showing the tracks of positions in different test periods from one animal. Top: baseline condition without stimulation in the first and last 10 min of the testing session. Bottom: same period of test session, but with light stimulation (460 nm). f, Left: summary data showing the total time spent on the antenna side in baseline and stimulation conditions. Two-way ANOVA, Sidak’s multiple comparisons test (Baseline vs Stim), ChR2, P = 0.001, Fluorophore, P = 0.9962. Right: percentage of time spent on the antenna side in different testing period. Two-way ANOVA, Sidak’s multiple comparisons (Stim, ChR2 vs Fluorophore), 0 – 10 min, P = 0.0008, 10 – 20 min, P = 0.0005. N = 6 mice/group. All data are represented as mean +/− SEM. ***P < 0.001. ns: not significant.

