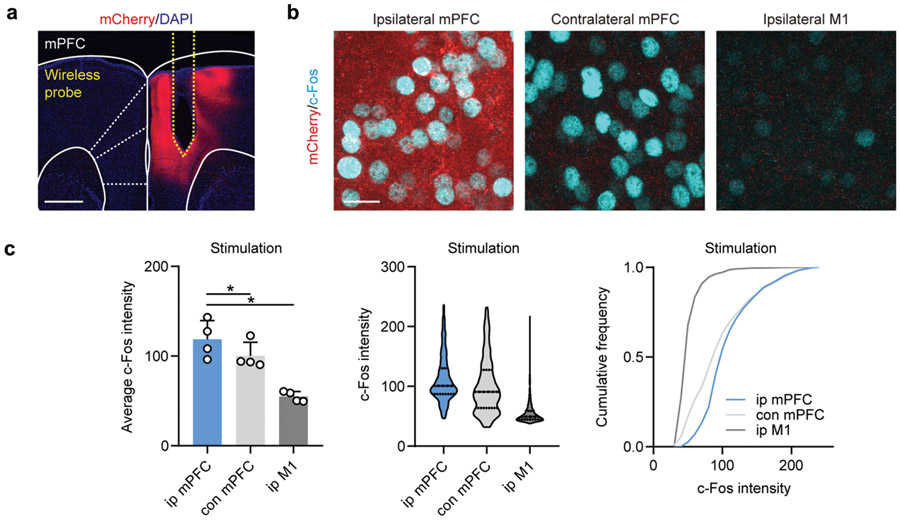
Extended Data Figure 9. Increased excitability of mPFC pyramidal neurons after stimulation.
a, Image of viral expression of ChR2.mCherry and probe placement. Scale bar, 500 μm. b, Images of c-Fos immunoreactivity in ipsilateral mPFC, interconnected contralateral mPFC, and ipsilateral M1 as a control region. Scale bar, 20 μm. c, Summary data show average c-Fos intensity in individual mice (left), the distribution of c-Fos neuronal particle intensities (middle), and cumulative frequency of c-Fos particle intensities. RM one-way ANOVA, P = 0.0025, Sidak’s multiple comparisons test, ipsilateral (ip) mPFC vs ipsilateral M1, P = 0.0201, contralateral (con) mPFC vs ipsilateral M1, P = 0.0370. N = 4 mice/group. Data represent mean +/− SEM; dashed lines in the violin plot show quantiles and median. * P < 0.05.

