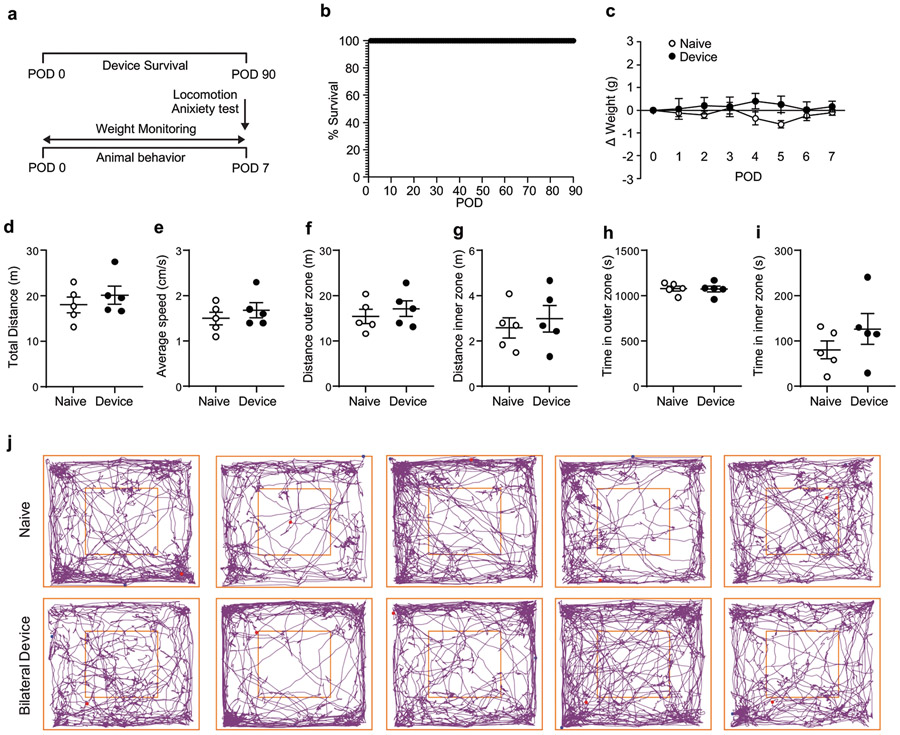
Extended Data Figure 3. Device longevity and behavioral outcomes for head mounted devices.
a, Cartoon representation of the timeline for monitoring device longevity and animal postoperative behavior. b, Routine testing of head mounted devices for 90 days (n=5 animals). c, Normalized weight assessment for 7 postoperative days (POD) after implantation of head mounted device (two-way ANOVA Sidak’s multiple comparison test; POD1 P = 0.9998, POD2 P = 0.9491, POD3 P > 0.9999, POD4 P = 0.3731, POD5 P = 0.2038, POD6 P = 0.9966, POD7 P = 0.9966; n=5 naïve & n=5 device animals). d, Total distance traveled (P = 0.6905), e, Average speed (P = 0.5952), f, Distance in the outer zone (P = 0.6905), g, Distance in the inner zone (P > 0.9999), h, Time in the outer zone (P > 0.9999), i, Time in the inner zone (P = 0.5476). (d-i), Locomotion effects of implantation were assessed using the open field test and a variety of parameters were measured (two-tailed unpaired t-test, Mann Whitney test; n=5 naïve & n=5 device animals). j, Graphical representation of individual animal behavior, implanted animals (top row) versus naïve controls (bottom row) in the open field test. Outer and inner squares represent the two zones. All data are represented as mean +/− SEM.

