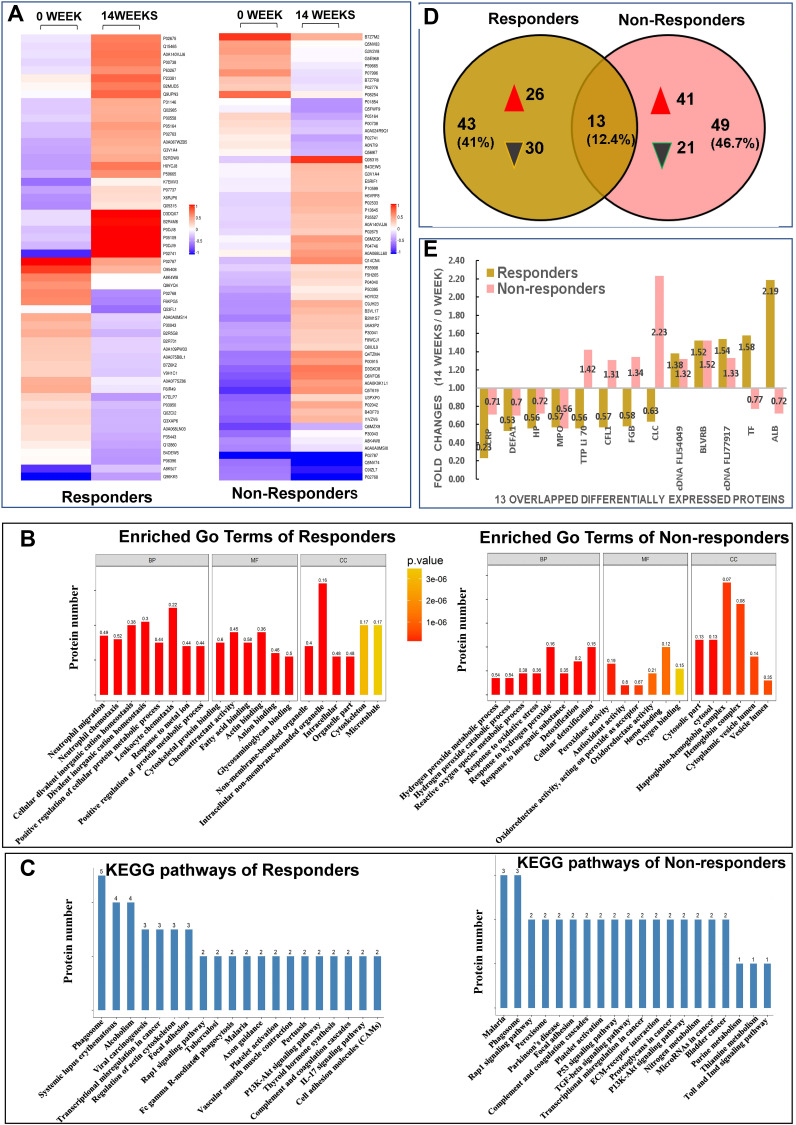
Figure 2.
Results from quantitative proteomic analysis screened from iTRAQ were displayed. (A) hierarchical cluster of DEPs were showed; left column was results from responders compared between weeks 14 and 0; right column was results from non-responders compared between weeks 14 and 0. (B) enriched GO terms of DEPs were showed; left panel was results from responders, right panel was results from non-responders. (C) KEGG pathways of DEPs were showed; left panel was results from responders, right panel was results from non-responders. (D) Venn diagrams of DEPs between responders and non-responders were conducted. There were 13 overlapping DEPs between 2 groups. (E) fold changes (14 weeks/0 week) of all 13 overlapping DEPs between responders and non-responders were showed.
Abbreviations: ALB, albumin; BP, biological process; BLVRB, flavin reductase NADPH; CC, cellular component; cDNA FLJ54049, highly similar to multimerin-2; cDNA FLJ77917, highly similar to Homo sapiens ubiquitin-conjugating enzyme E2L3; CFL, cofilin 1; CLC, galectin-10; DEFA1, neutrophil defensin 1; DEPs, differentially expressed proteins; FGB, fibrinogen beta chain; GO, gene ontology; HP, haptoglobin; iTRAQ, isobaric tags for relative and absolute quantification; Kyoto encyclopedia of genes and genome, KEGG; MF, molecular function; MPO, myeloperoxidase; TF, serotransferrin; TTP Li70, testicular tissue protein Li 70.

