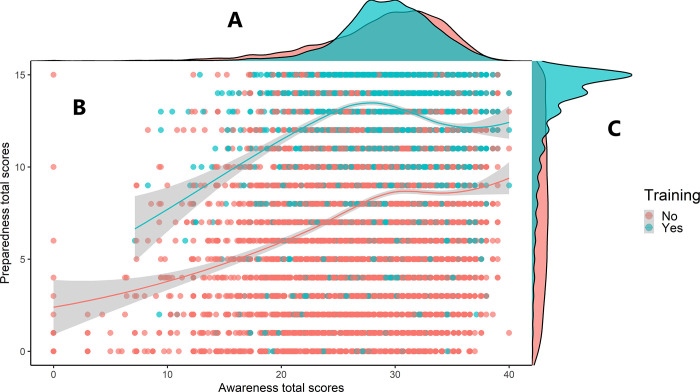
Fig 3. Two multivariate cowplots illustrating the effect of training on preparedness and awareness.
Part A illustrates the distribution of awareness scores. Part B shows individual total scores of preparedness and awareness. The center lines were computed using Loess method with the shadow representing their 95% confidence intervals. Part C illustrates the distribution of preparedness scores.

