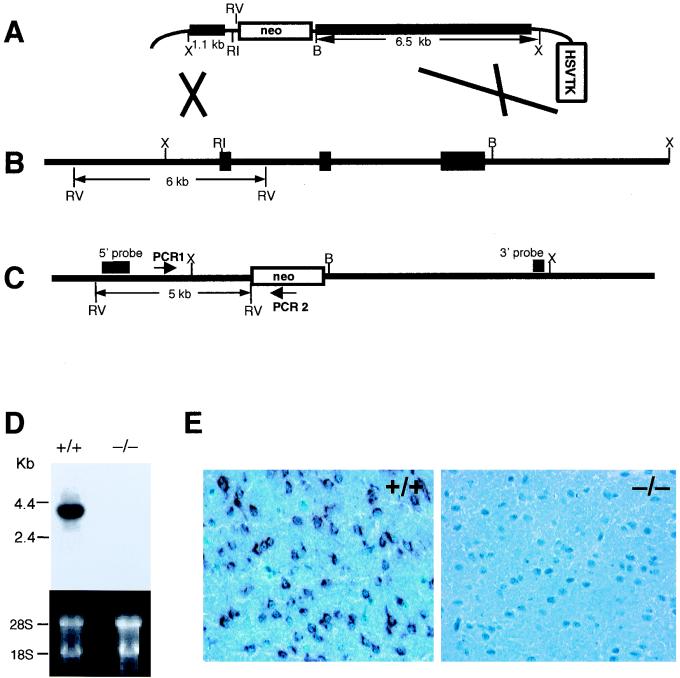
FIG. 1.
Gene targeting of fractalkine. (A) Targeting vector. Thick lines represent regions of homology to fractalkine. The restriction enzyme sites used to subclone these regions are indicated; RV, EcoRV; RI, EcoRI; B, BglI; X, XbaI. (B) Wild-type fractalkine locus. Black rectangles represent exons; transcription is from left to right. The EcoRV fragment diagnostic of the wild-type locus (6 kb) is shown. (C) fractalkine targeted locus. The positions of the oligonucleotide primers (PCR1 and PCR2) used to screen targeted ES cells are indicated, as is the EcoRV fragment diagnostic of the targeted locus. The arrow indicates the transcriptional direction of neo. (D) Northern blot analysis of fractalkine RNA from the brain of a wild-type (+/+) mouse and a fractalkine−/− mouse. The ethidium bromide-stained gel is shown to demonstrate equal loading of RNA samples. (E) Immunohistochemical analysis of fractalkine in the brain of a wild-type and a fractalkine−/− mouse. Dark-staining regions represent cells producing fractalkine protein; neurons of the wild-type mouse are stained, but not those from the fractalkine−/− mouse.

