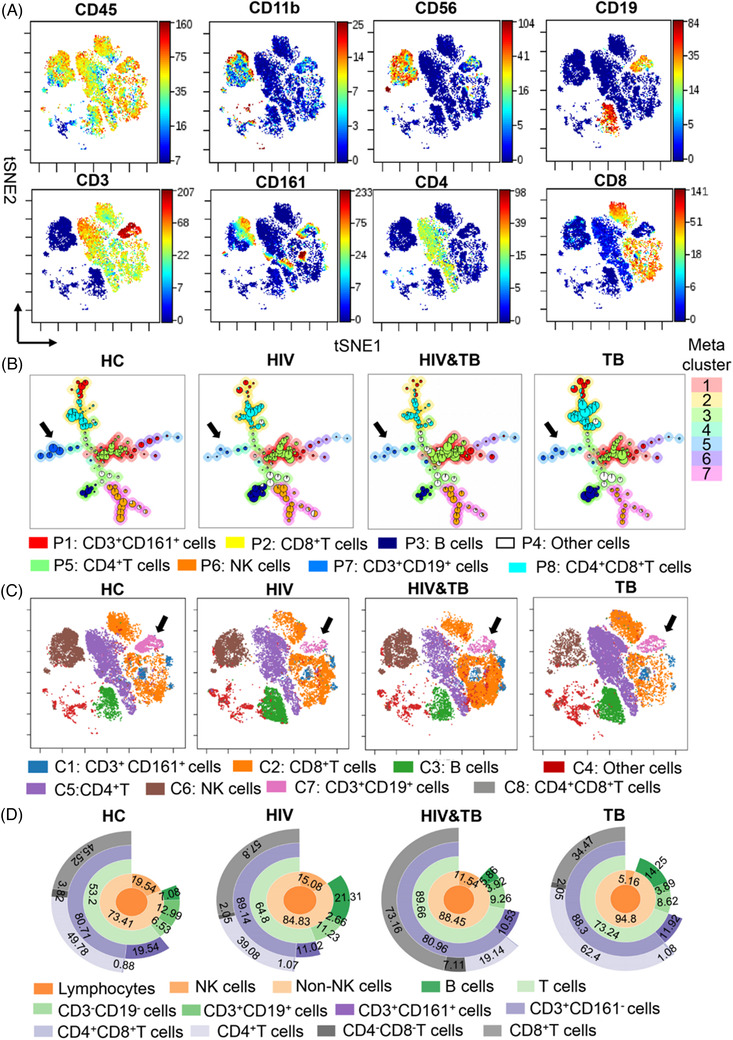
FIGURE 2.

Validation of CD3+CD19+ cells and functional changes among patients with human immunodeficiency virus (HIV), Mycobacterium tuberculosis (Mtb) and HIV‐Mtb coinfection groups compared to healthy controls (HCs). (A) Eight surface markers (CD3, CD4, CD8, CD11b, CD19, CD45, CD56 and CD161) were used to construct a Visne map. (B and C) A FlowSOM and a Visne map of gated CD45+CD11b–CD56–CD3+ live single cells were used to depict the immune landscape. The black arrows in panels (B) and (C) indicate CD3+CD19+ subsets. (D) An abundance of lymphocyte cell subsets was generated using the sunburst method
