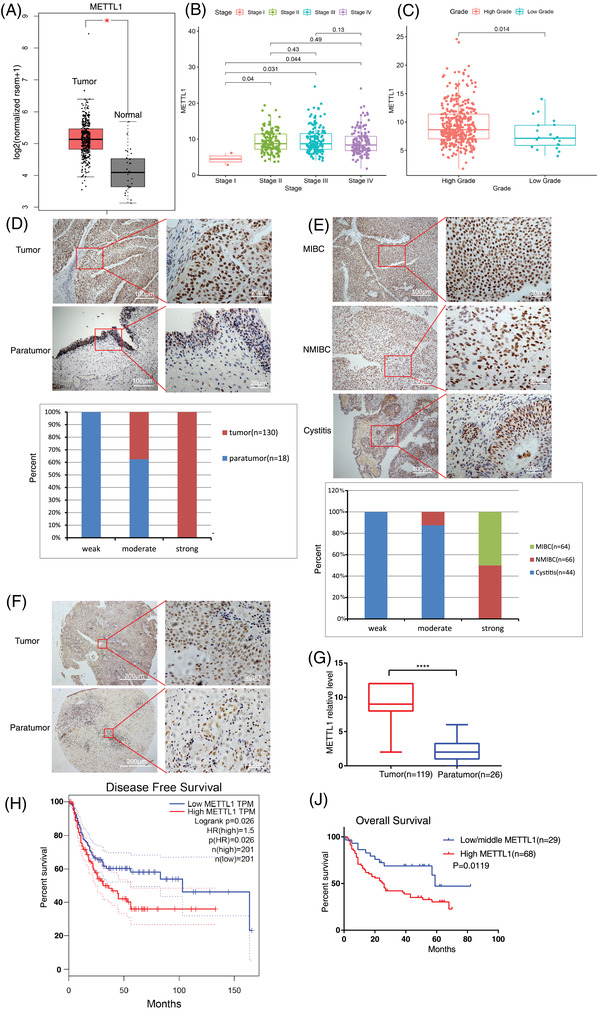
FIGURE 1.

METTL1 is upregulated in bladder cancer (BC) and associated with poor prognosis. (A) Comparison of METTL1 mRNA expression between tumour and normal tissue in TCGA dataset (n = 404 in tumour and n = 28 in normal, *P < 0.05). (B) Expression of METTL1 in BC based on individual cancer stages in TCGA dataset(n = 412). (C) Comparison of METTL1 mRNA expression between high grade and low grade in BC in TCGA dataset (n = 392 in high grade tumour and n = 20 in low grade tumour, **P = 0.014). (D) Representative immunohistochemistry (IHC) staining images of METTL1 expression in tumour tissues and matched paratumour tissues in patient sample. The nether panel showed histogram of METTL1 expression in tumour and paratumour. Scale bars: (left panel) 100 μm, (right panel) 20 μm. (E) Upper panel: representative IHC staining images of METTL1 expression in muscle‐invasive bladder cancer (MIBC), non‐muscle‐invasive bladder cancer (NMIBC) and cystitis; lower panel: histogram of METTL1 expression in cystitis and bladder cancer tissues. Scale bars: (left panel) 100 μm, (right panel) 20 μm. (F) Representative IHC staining images of METTL1 expression in tumour tissues and matched paratumour tissues in BC tissue microarray (TMA). Scale bars: (left panel) 200 μm, (right panel) 20 μm. (G) Statistical analysis of METTL1 expression between paratumour tissues (n = 26) and tumour tissues (n = 119) in BC TMA (****P < 0.0001). (H) The Kaplan–Meier survival curve of the disease‐free survival in TCGA database (*P = 0.026). (I) The Kaplan–Meier survival curve of the overall survival between 97 patients with high or low/middle METTL1 expression in BC TMA (*P = 0.0119)
